
Bernardino JI. Lancet HIV. 2015 Nov;2(11):e464-73 ; Lambert-Niclot S. JAC 2015 (in press) ; Raffi F. Lancet 2014; 384:1942-51.
Head-to-head comparative trials for first line ART since 2006
» 2 drugs vs 3 drugs
» NRTI-Sparing
» DRV/r + RAL vs DRV/r + FTC/TDF
RAL, DRV/r, FTC/TDF, TDF, FTC
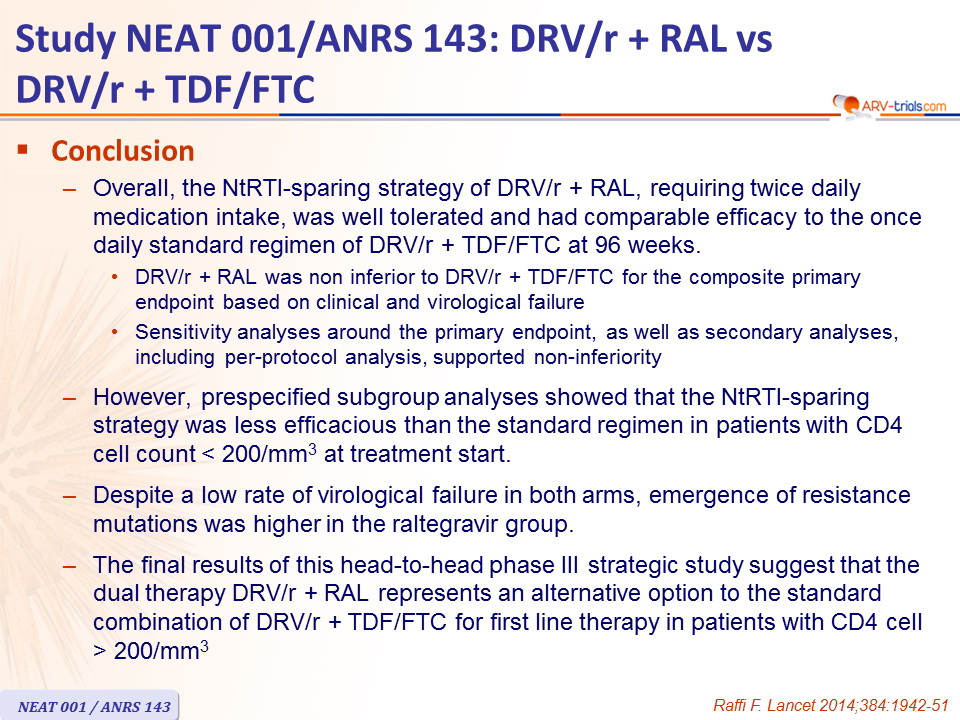
- Overall, the NtRTI -sparing strategy of DRV/ r + RAL, requiring twice daily medication intake, was well tolerated and had comparable efficacy to the once daily standard regimen of DRV/ r + TDF/FTC at 96 weeks.
- DRV/ r + RAL was non inferior to DRV/ r + TDF/FTC for the composite primary endpoint based on clinical and virological failure
- Sensitivity analyses around the primary endpoint, as well as secondary analyses, including per-protocol analysis, supported non-inferiority
- However, prespecified subgroup analyses showed that the NtRTI -sparing strategy was less efficacious than the standard regimen in patients with CD4 cell count < 200/mm3 at treatment start.
- Despite a low rate of virological failure in both arms, emergence of resistance mutations was higher in the raltegravir group.
- The final results of this head-to-head phase III strategic study suggest that the dual therapy DRV/ r + RAL represents an alternative option to the standard combination of DRV/ r + TDF/FTC for first line therapy in patients with CD4 cell > 200/mm3
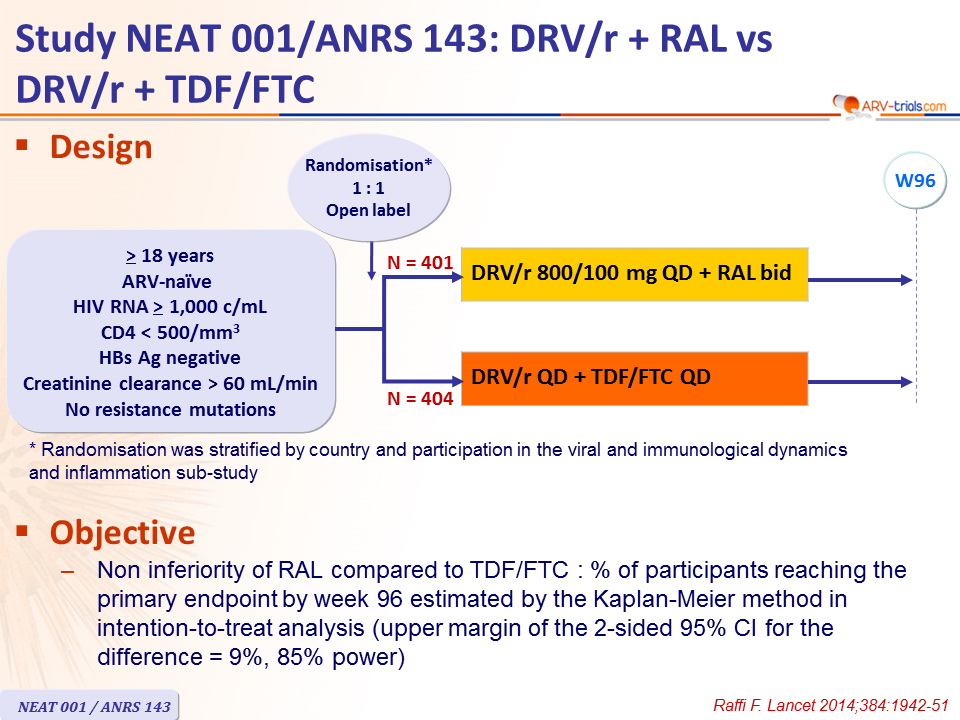
Design :
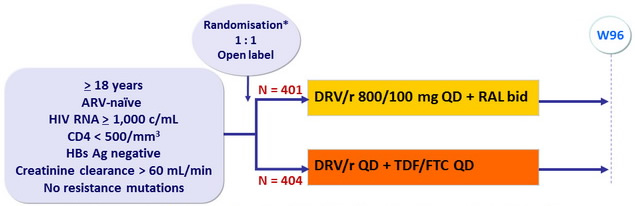
*
Randomisation was stratified by country and participation in the viral and immunological dynamics
and inflammation sub-study
Objective :
- Non inferiority of RAL compared to TDF/FTC : % of participants reaching the primary endpoint by week 96 estimated by the Kaplan-Meier method in intention-to-treat analysis (upper margin of the 2-sided 95% CI for the difference = 9%, 85% power)
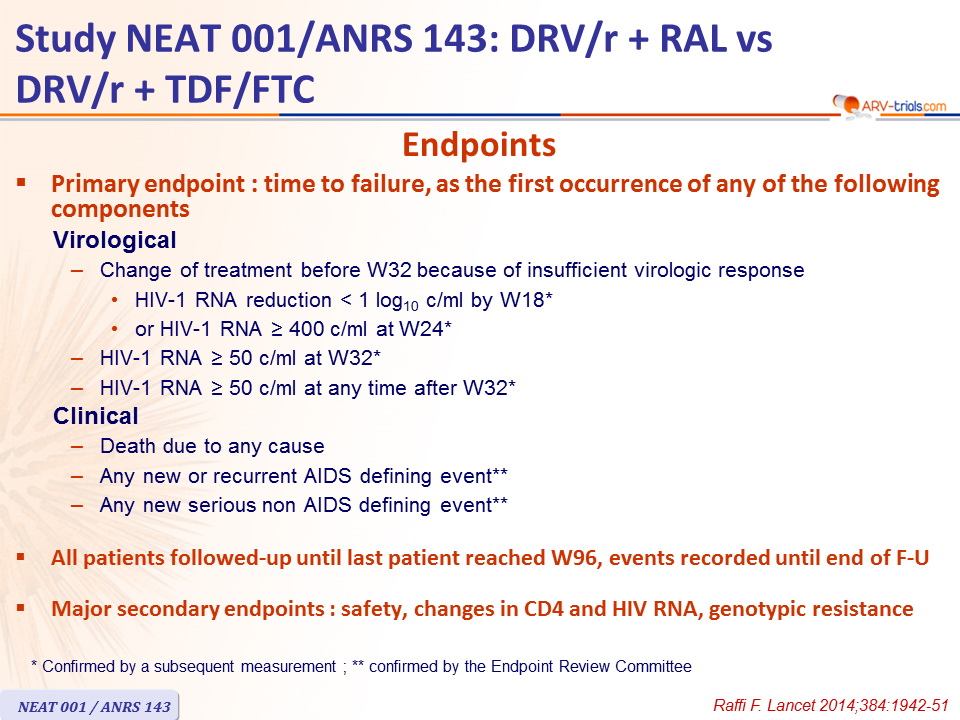
Endpoints :
- Primary endpoint :
time to failure, as the first occurrence of any of the following components
- Virological
- Change of treatment before W32 because of insufficient virologic response
- HIV-1 RNA reduction < 1 log10 c/ml by W18*
- or HIV-1 RNA ≥ 400 c/ml at W24*
- HIV-1 RNA ≥ 50 c/ml at W32*
- HIV-1 RNA ≥ 50 c/ml at any time after W32*
- Change of treatment before W32 because of insufficient virologic response
- Clinical
- Death due to any cause
- Any new or recurrent AIDS defining event**
- Any new serious non AIDS defining event**
- Virological
- All patients followed-up until last patient reached W96, events recorded until end of F-U
- Major secondary endpoints : safety, changes in CD4 and HIV RNA, genotypic resistance
* Confirmed by a subsequent measurement ; ** confirmed by the Endpoint Review Committee
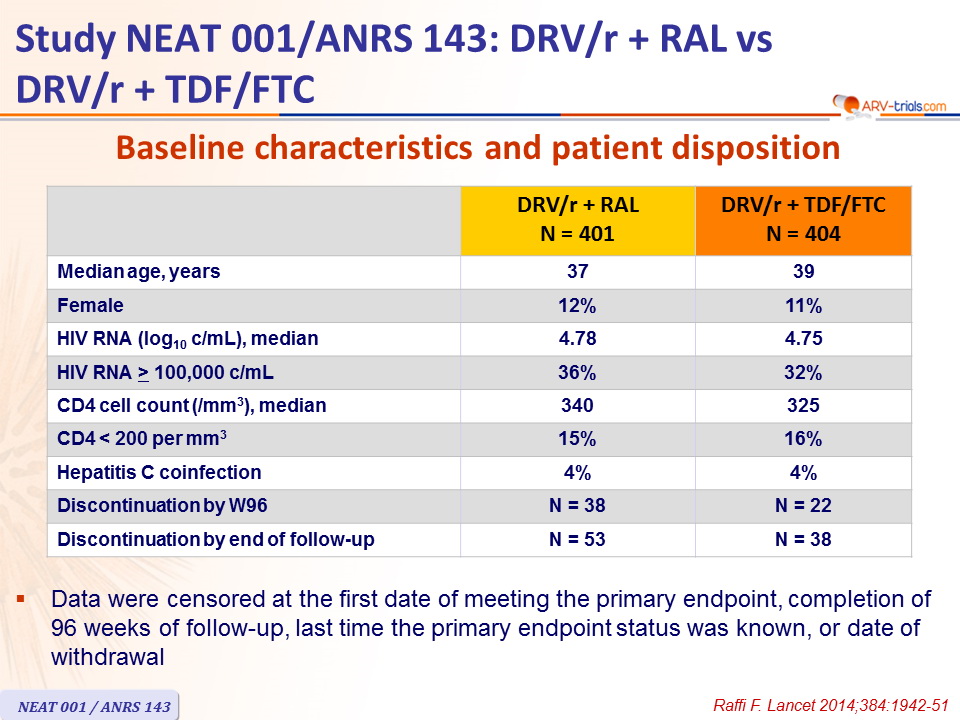
Baseline characteristics and patient disposition :
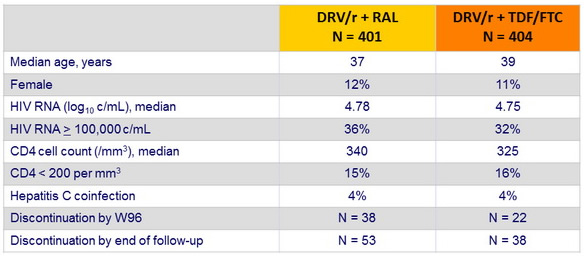
- Data were censored at the first date of meeting the primary endpoint, completion of 96 weeks of follow-up, last time the primary endpoint status was known, or date of withdrawal
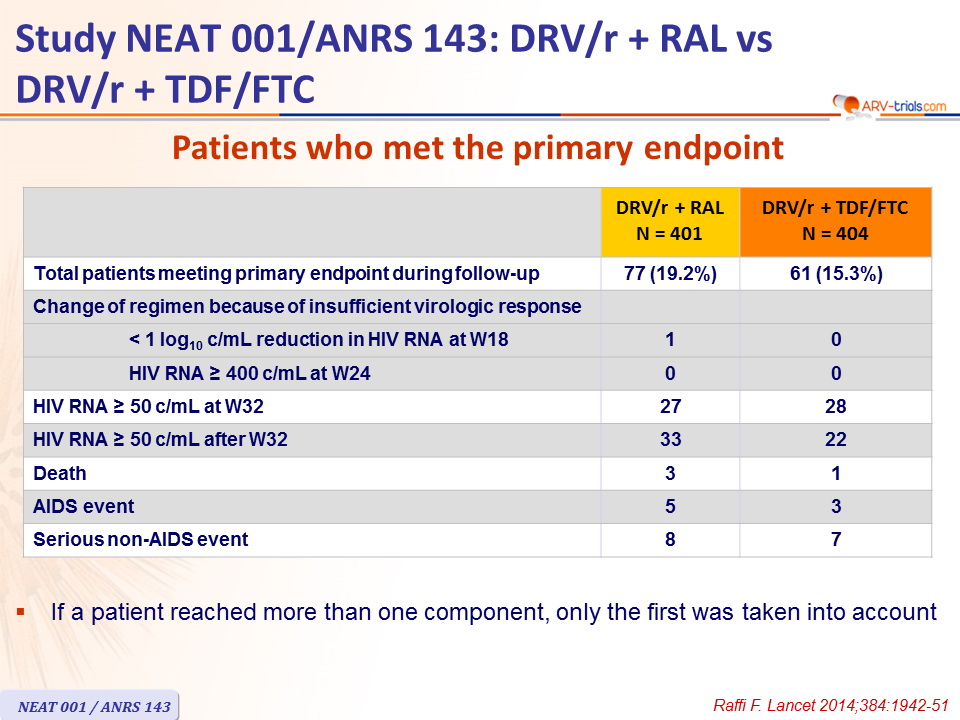
Patients who met the primary endpoint :
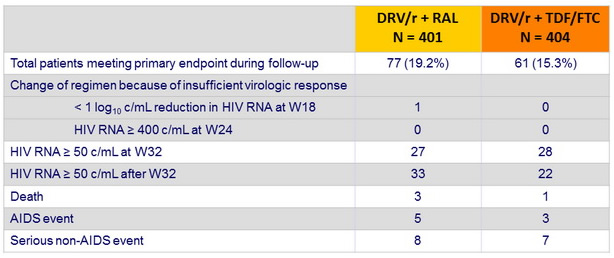
- If a patient reached more than one component, only the first was taken into account
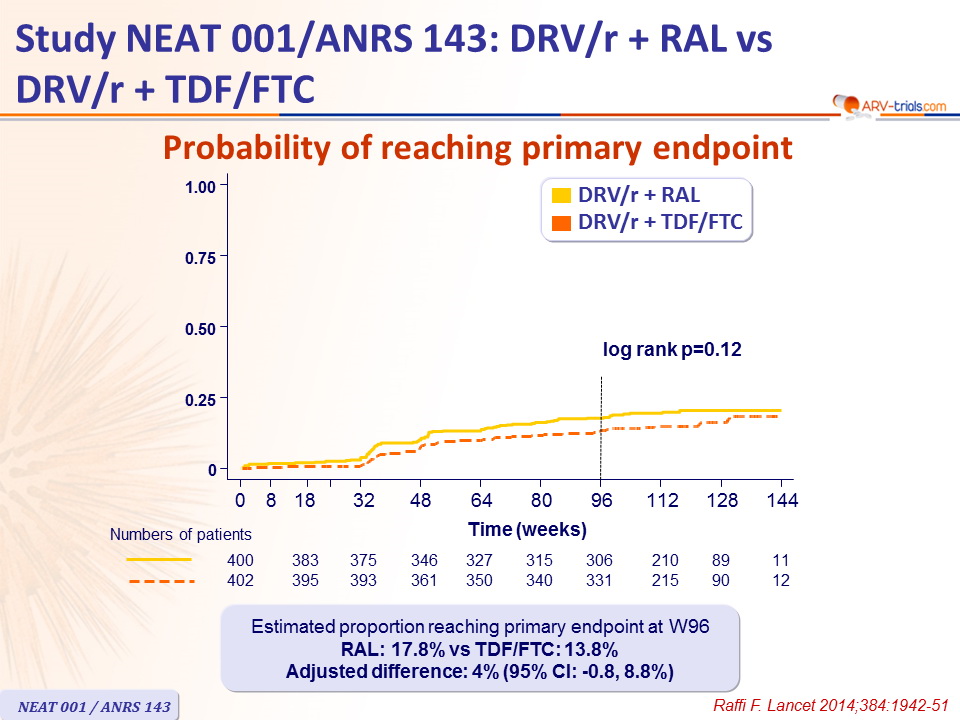
Probability of reaching primary endpoint :
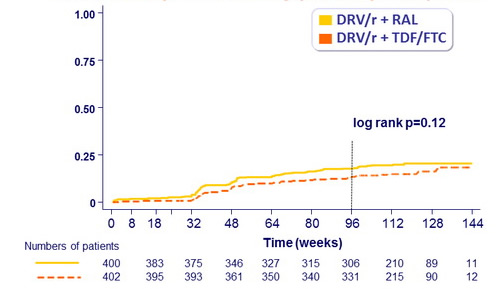
Estimated proportion reaching primary endpoint at W96
RAL: 17.8% vs TDF/FTC: 13.8%
Adjusted difference: 4% (95% CI: -0.8, 8.8%)
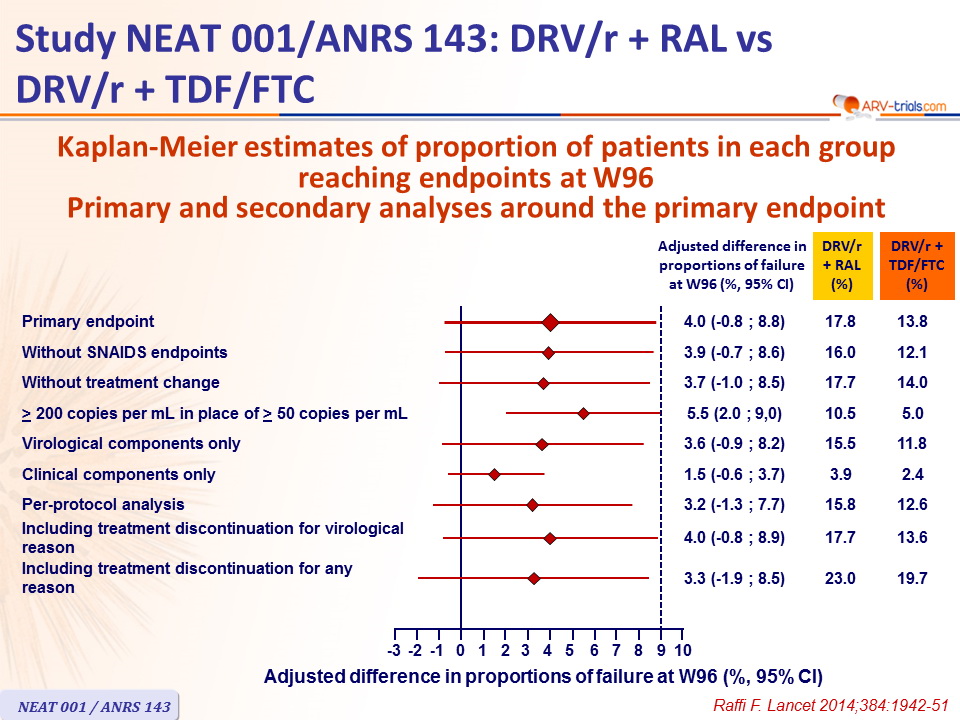
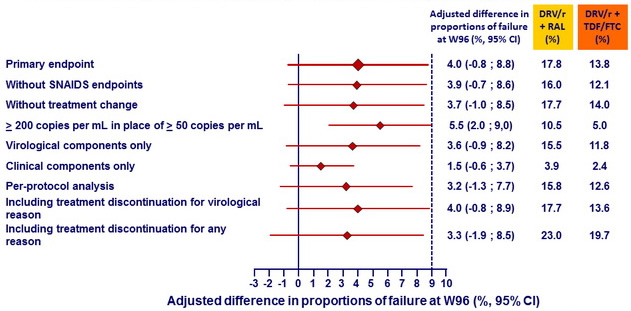
Kaplan-Meier estimates of proportion of patients in each group reaching endpoints at W96 - Primary and secondary analyses around the primary endpoint :
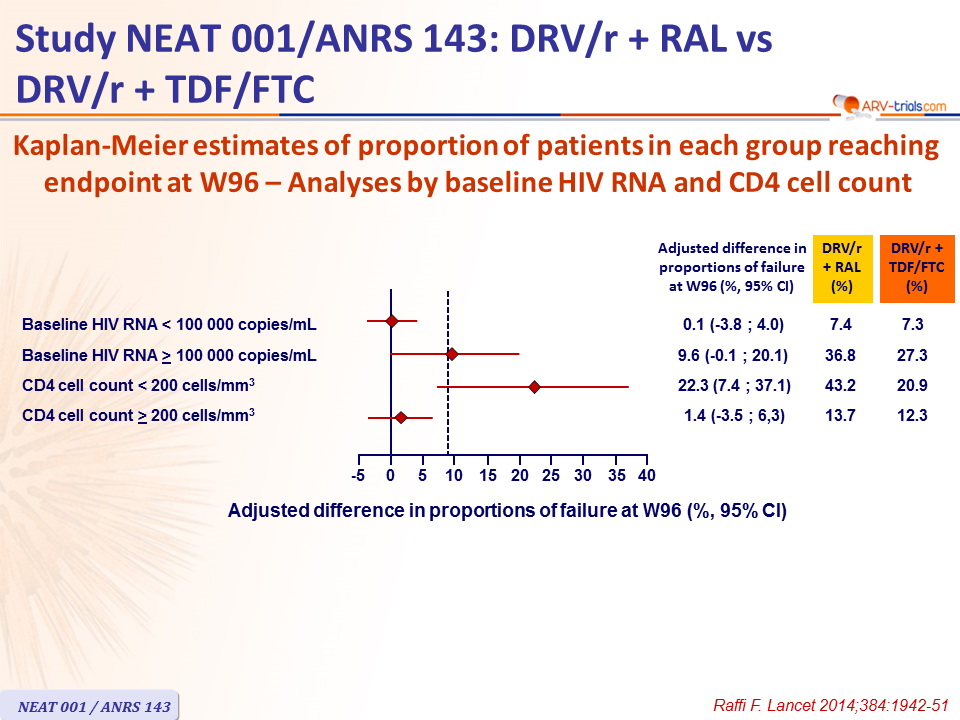
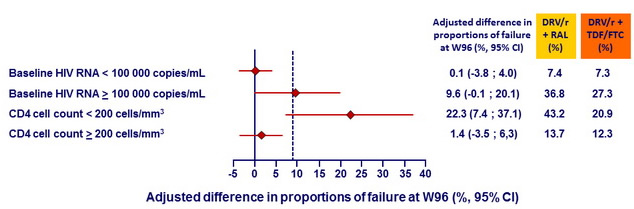
Kaplan-Meier estimates of proportion of patients in each group reaching endpoint at W96 – Analyses by baseline HIV RNA and CD4 cell count :
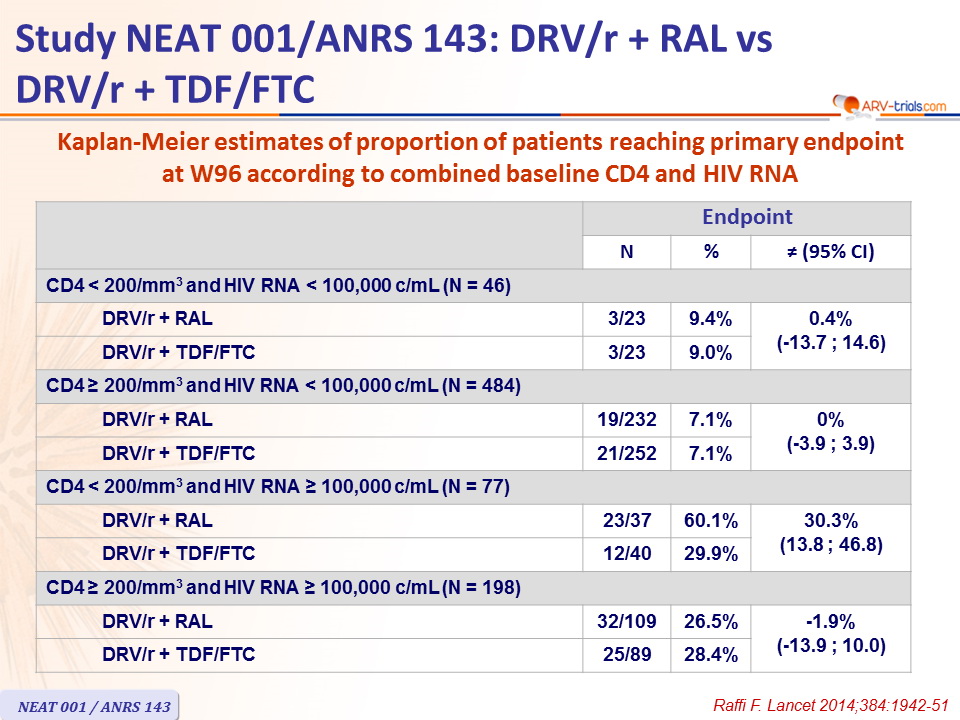
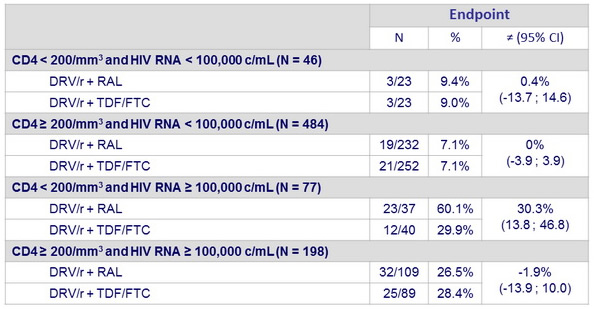
Kaplan-Meier estimates of proportion of patients reaching primary endpoint at W96 according to combined baseline CD4 and HIV RNA :
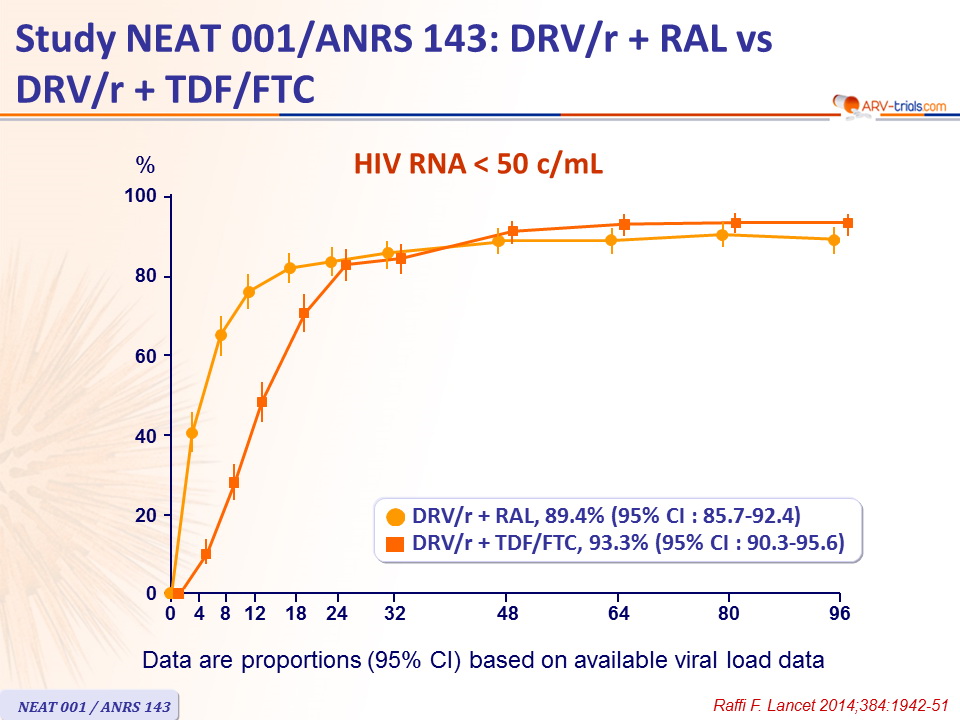
HIV RNA < 50 c/mL :
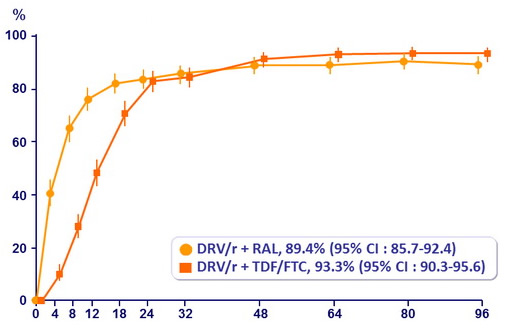
Data are proportions (95% CI) based on available viral load data
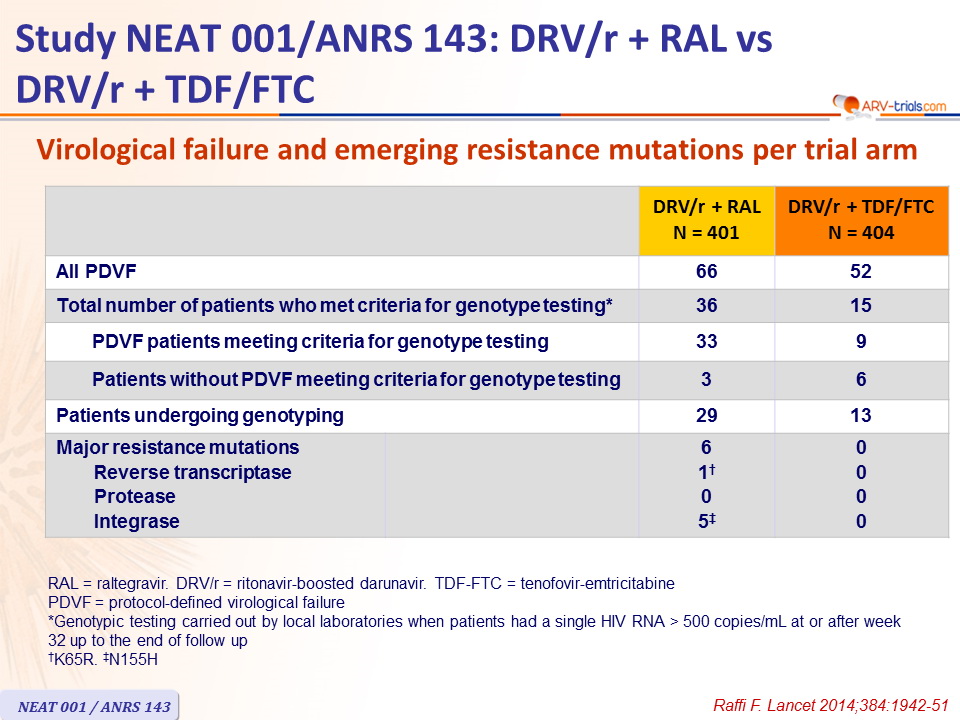
Virological failure and emerging resistance mutations per trial arm :
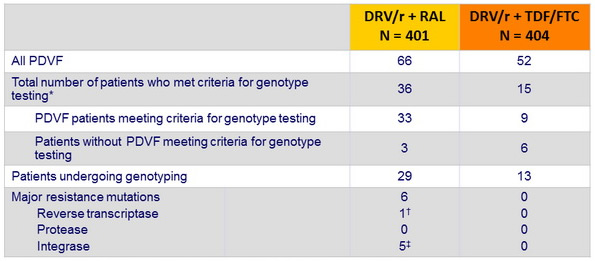
RAL = raltegravir . DRV/r = ritonavir-boosted darunavir . TDF-FTC = tenofovir - emtricitabine
PDVF = protocol - defined virological failure
* Genotypic testing carried out by local laboratories when patients had a single HIV RNA > 500 copies/ mL at or after week 32 up to the end of follow up
† K65R. ‡ N155H
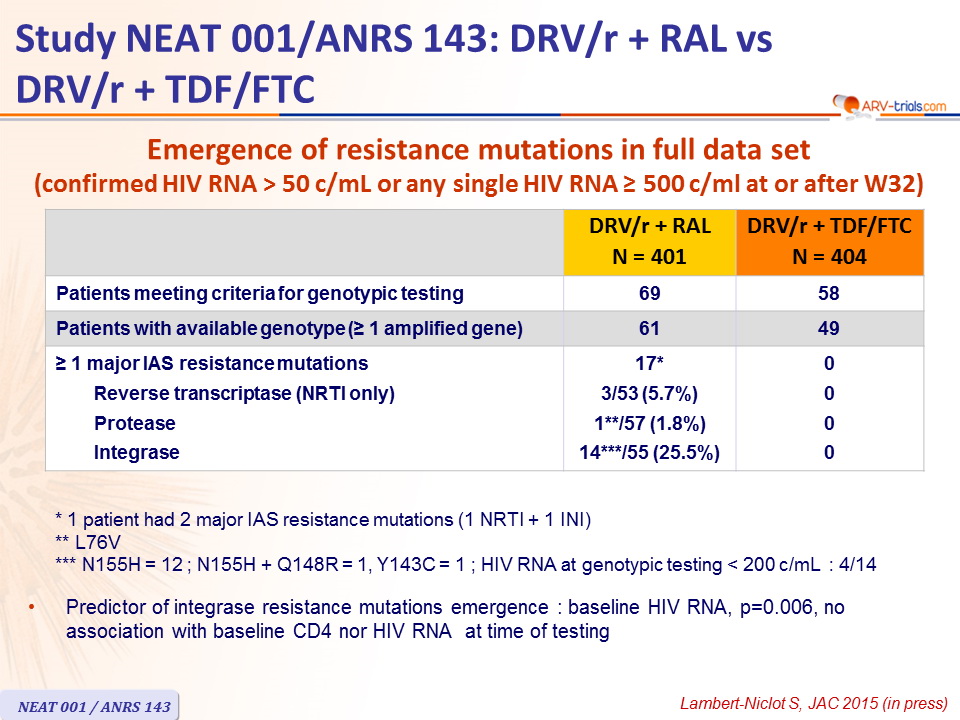
Emergence of resistance mutations in full data set
(confirmed HIV RNA > 50 c/ mL or any single HIV RNA ≥ 500 c/ml at or after W32)
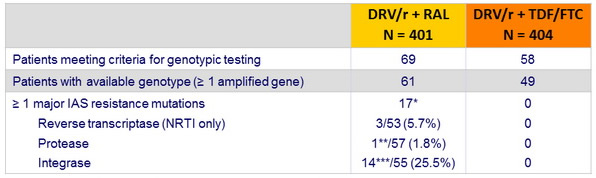
* 1 patient had 2 major IAS resistance mutations (1 NRTI + 1 INI)
** L76V
*** N155H = 12 ; N155H + Q148R = 1, Y143C = 1 ; HIV RNA at genotypic testing < 200 c/ mL : 4/14
- Predictor of integrase resistance mutations emergence : baseline HIV RNA, p=0.006, no association with baseline CD4 nor HIV RNA at time of testing
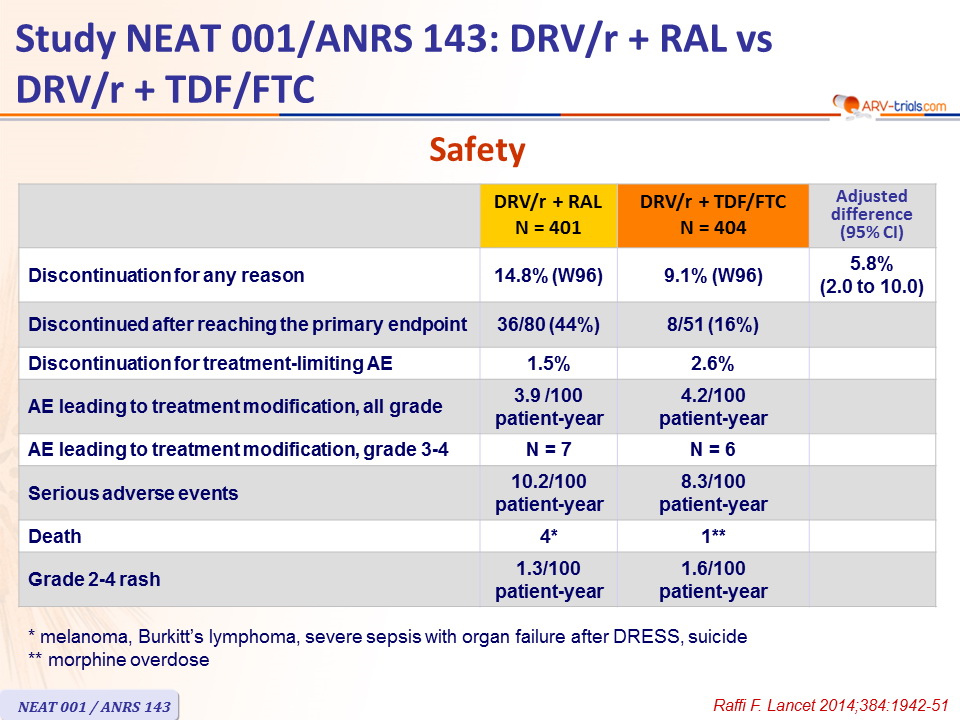
Safety :
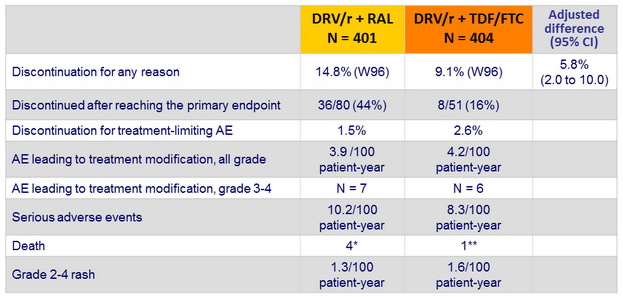
* melanoma, Burkitt's lymphoma, severe sepsis with organ failure after DRESS, suicide
** morphine overdose
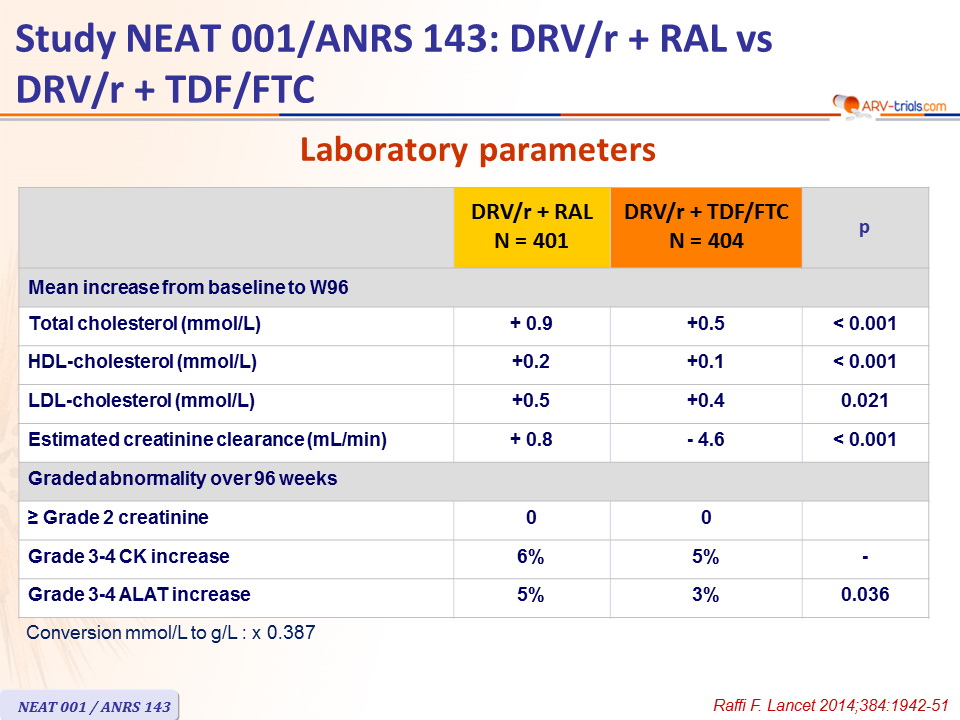
Laboratory parameters :
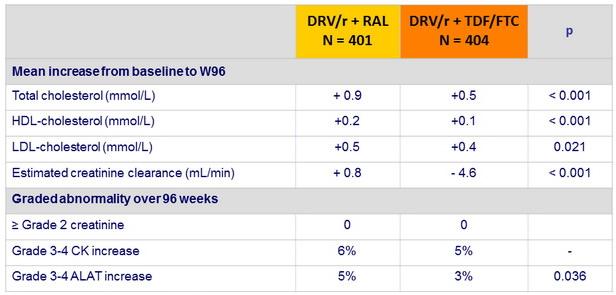
Conversion mmol /L to g/L : x 0.387
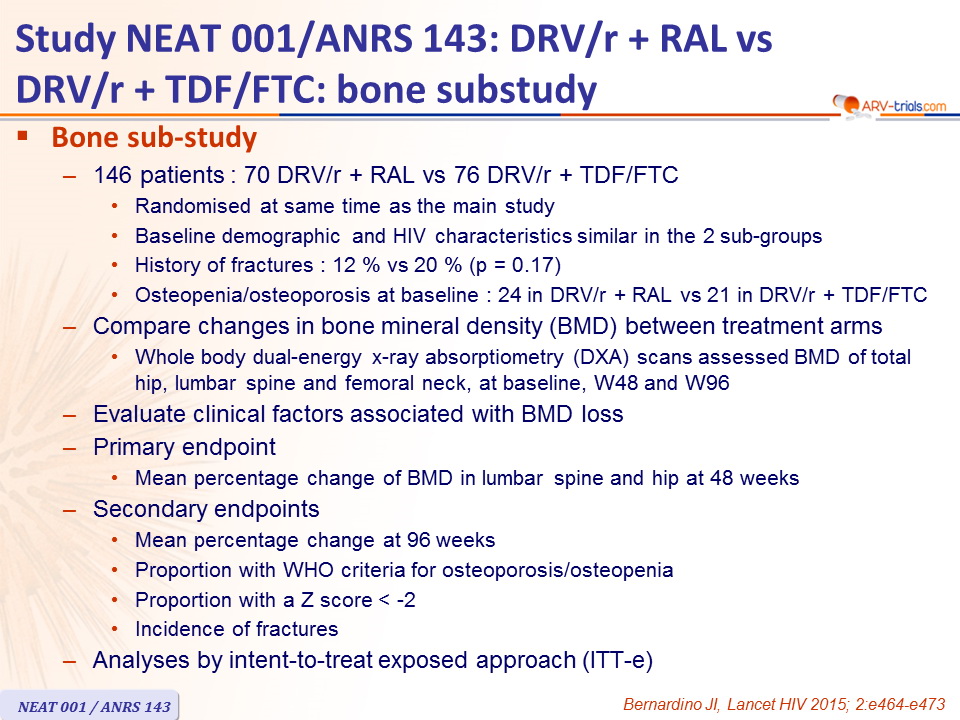
Bone sub-study :
- 146 patients : 70 DRV/r + RAL vs 76 DRV/r + TDF/FTC
- Randomised at same time as the main study
- Baseline demographic and HIV characteristics similar in the 2 sub-groups
- History of fractures : 12 % vs 20 % (p = 0.17)
- Osteopenia /osteoporosis at baseline : 24 in DRV/r + RAL vs 21 in DRV/r + TDF/FTC
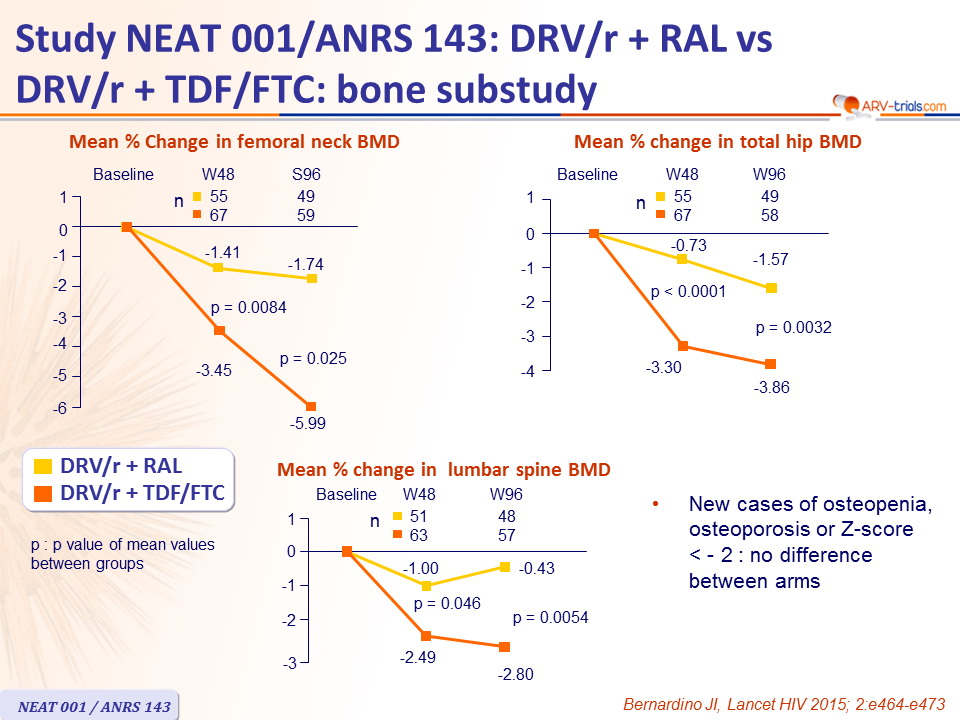
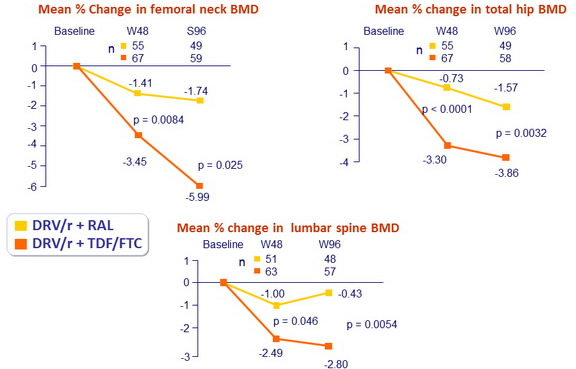
- Compare changes in bone mineral density (BMD) between treatment arms
- Whole body dual-energy x-ray absorptiometry (DXA) scans assessed BMD of total hip, lumbar spine and femoral neck, at baseline, W48 and W96
- Evaluate clinical factors associated with BMD loss
- Primary endpoint
- Mean percentage change of BMD in lumbar spine and hip at 48 weeks
- Secondary endpoints
- Mean percentage change at 96 weeks
- Proportion with WHO criteria for osteoporosis/ osteopenia
- Proportion with a Z score < -2
- Incidence of fractures
- Analyses by intent-to-treat exposed approach (ITT-e)
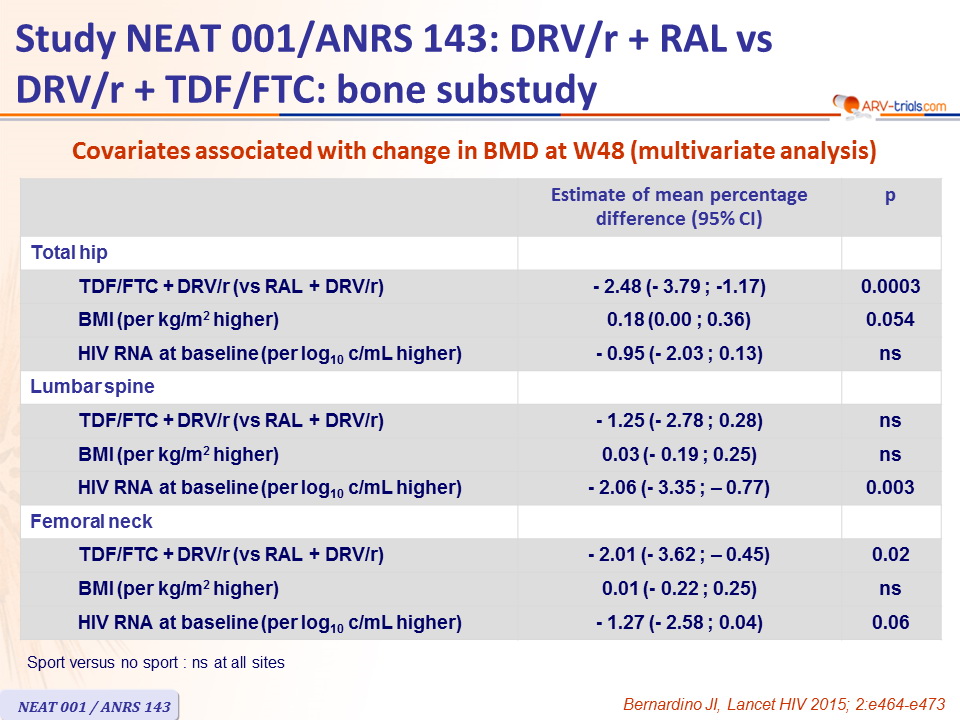
Covariates associated with change in BMD at W48 (multivariate analysis)
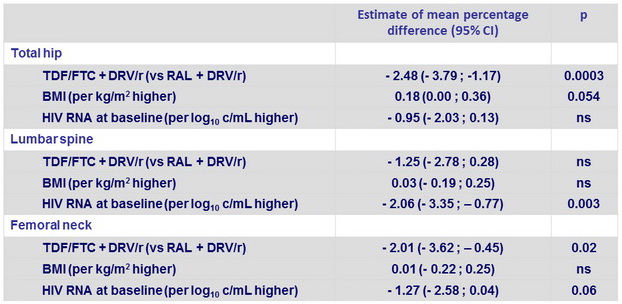
Sport versus no sport : ns at all sites
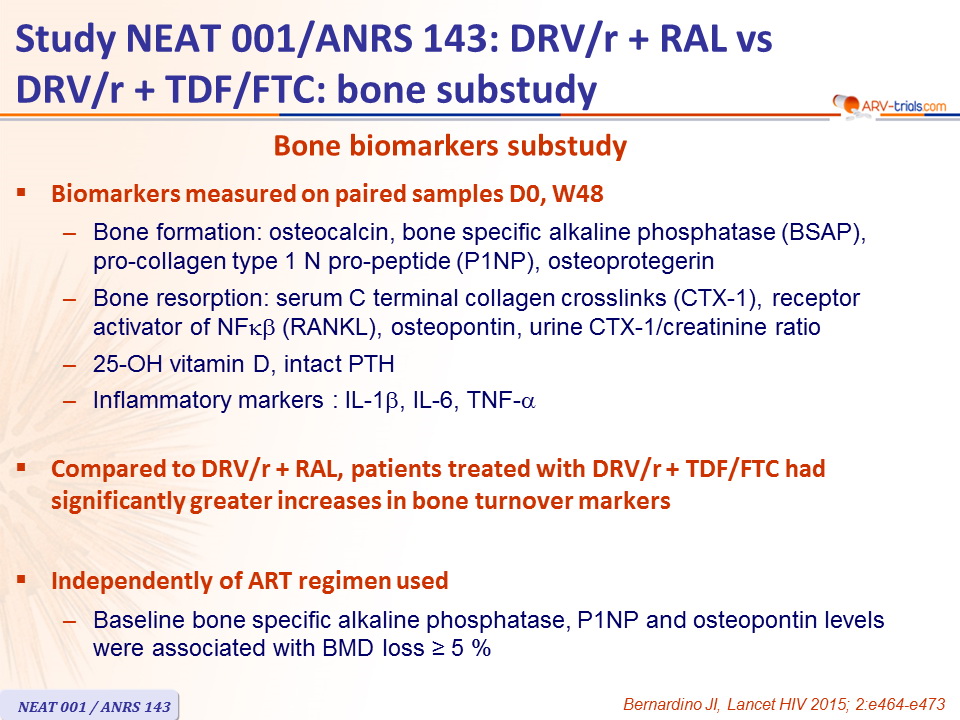
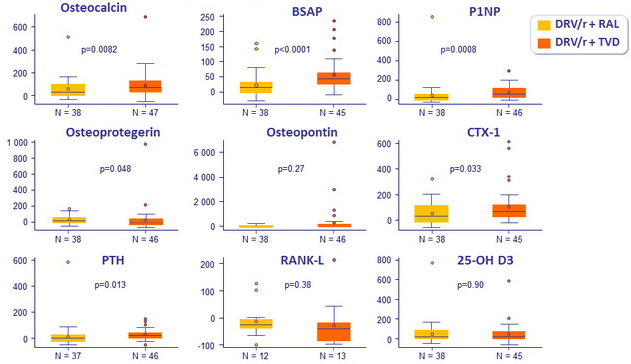
Bone biomarkers substudy
- Biomarkers measured on paired samples D0, W48
- Bone formation: osteocalcin, bone specific alkaline phosphatase (BSAP),
pro-collagen type 1 N pro-peptide (P1NP), osteoprotegerin - Bone resorption : serum C terminal collagen crosslinks (CTX-1), receptor activator of NF kb (RANKL), osteopontin, urine CTX-1/ creatinine ratio
- 25-OH vitamin D, intact PTH
- Inflammatory markers : IL-1 b, IL-6, TNF- a
- Bone formation: osteocalcin, bone specific alkaline phosphatase (BSAP),
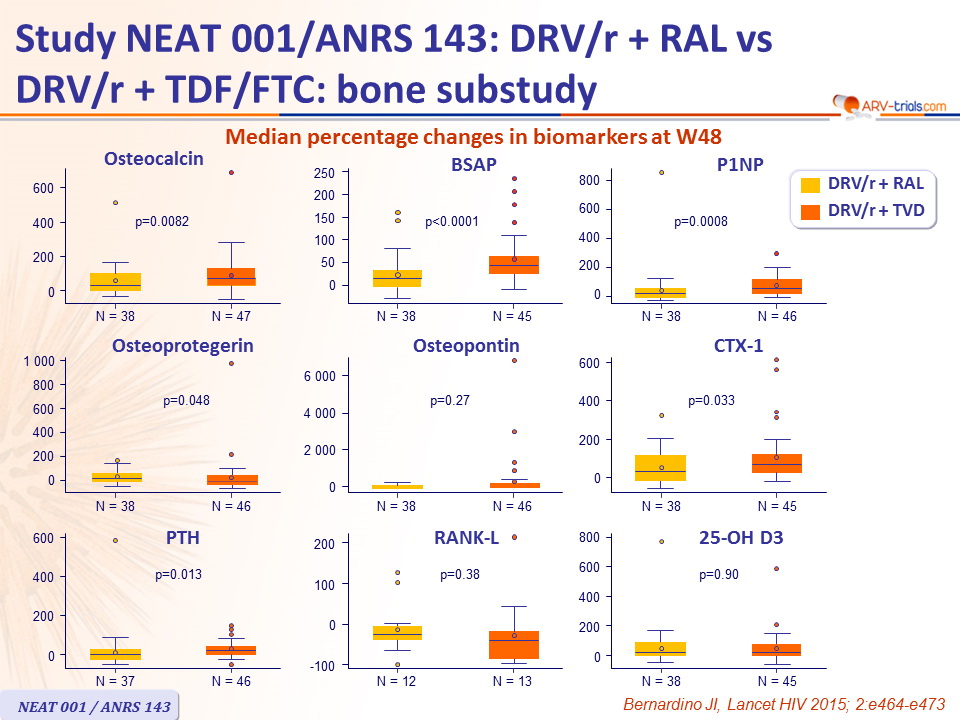
- Compared to DRV/r + RAL, patients treated with DRV/r + TDF/FTC had significantly greater increases in bone turnover markers
- Independently of ART regimen used
- Baseline bone specific alkaline phosphatase, P1NP and osteopontin levels were associated with BMD loss ≥ 5
Median percentage changes in biomarkers at W48
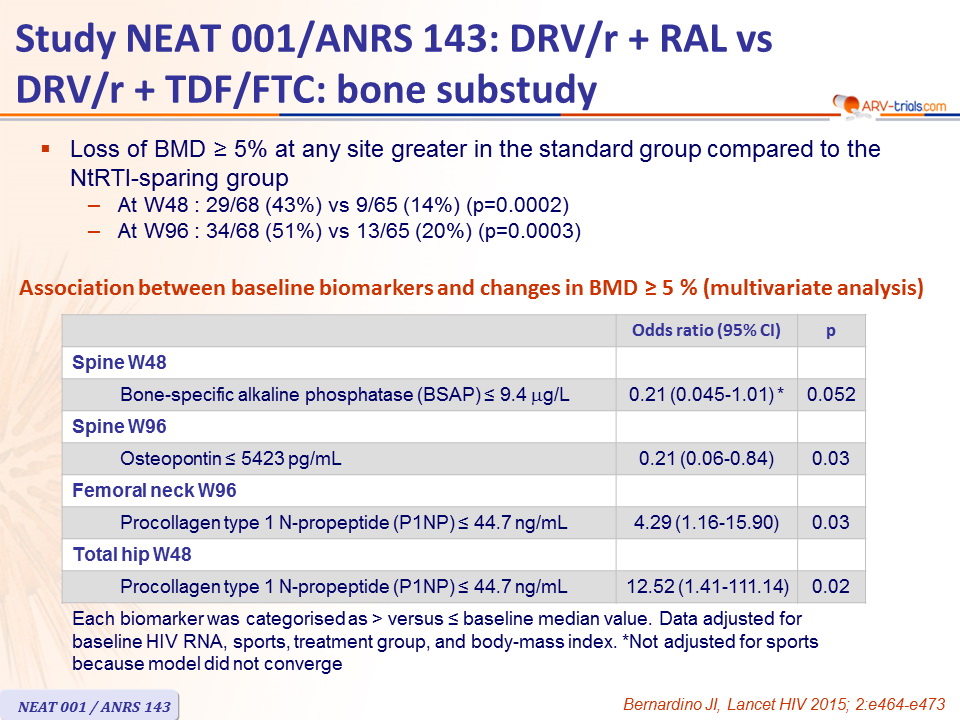
- Loss of BMD ≥ 5 % at any site greater in the standard group compared to the NtRTI-sparing group
- At W48 : 29/68 (43%) vs 9/65 (14%) (p=0.0002)
- At W96 : 34/68 (51%) vs 13/65 (20%) (p=0.0003)
Association between baseline biomarkers and changes in BMD ≥ 5 %
(multivariate analysis)
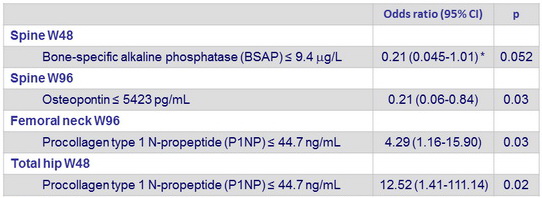
Each biomarker was categorised as > versus ≤ baseline median value. Data adjusted for baseline HIV RNA, sports, treatment group, and body- mass index. * Not adjusted for sports because model did not converge