Switch studies in virologically suppressed patients
Switch to RAL-containing regimen
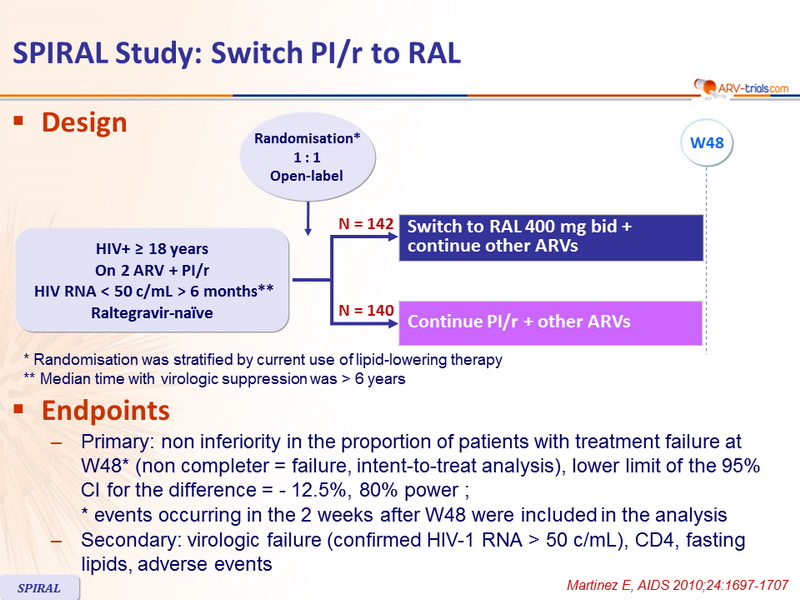
SPIRAL Study: Switch PI/r to RAL
Original article : AIDS. 2010 Jul 17;24(11):1697-707 – E Martinez ; AIDS. 2012 Nov 28;26(18):2315-26 – E Martinez ; AIDS. 2012 Feb 20;26(4):475-81 – A Curran ; AIDS Res Hum Retroviruses. 2013 Feb;29(2):235-41 – E Martinez ; Atherosclerosis. 2012 Nov;225(1):200-7 – M Saumoy ; J Antimicrob Chemother. 2013 Feb;68(2):409-13 – M Masiá
Last update :
02/06/2015
Dr Anton Pozniak
Chelsea and Westminster Hospital
London, UK

- In HIV-infected adults with sustained plasma �HIV-1 RNA < 50 c/mL on PI/r-containing ARV therapy, switching from the PI/r component to raltegravir results
- In non inferior efficacy
- And a better lipid profile

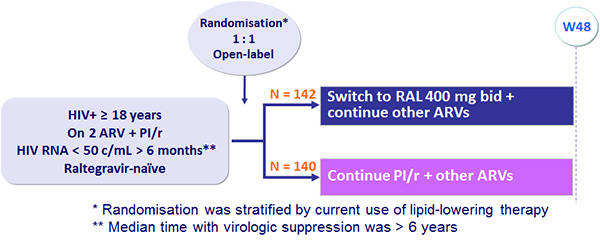
Design :
Endpoints :
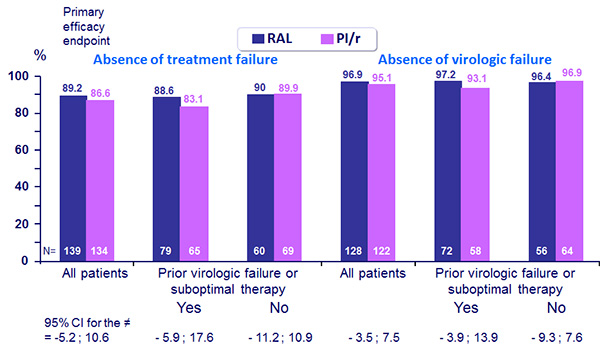
- Primary: non inferiority in the proportion of patients with treatment failure at W48* (non completer = failure, intent-to-treat analysis), lower limit of the 95% CI for the difference = - 12.5%, 80% power ; * events occurring in the 2 weeks after W48 were included in the analysis
- Secondary: virologic failure (confirmed HIV-1 RNA > 50 c/mL), CD4, fasting lipids, adverse events
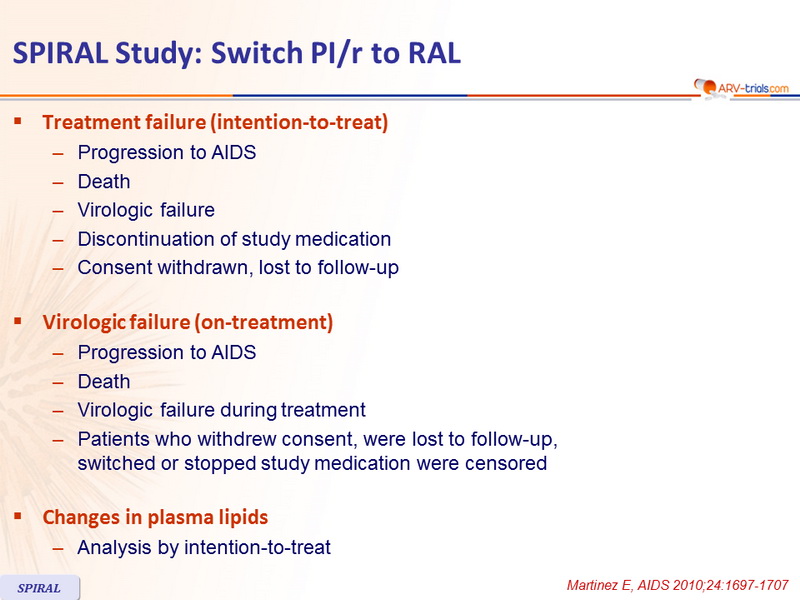
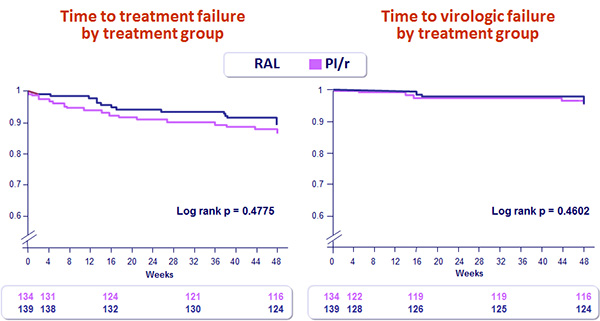
Treatment failure (intention-to-treat)
- Progression to AIDS
- Death
- Virologic failure
- Discontinuation of study medication
- Consent withdrawn, lost to follow-up
Virologic failure (on-treatment)
- Progression to AIDS
- Death
- Virologic failure during treatment
- Patients who withdrew consent, were lost to follow-up, �switched or stopped study medication were censored
Changes in plasma lipids
- Analysis by intention-to-treat
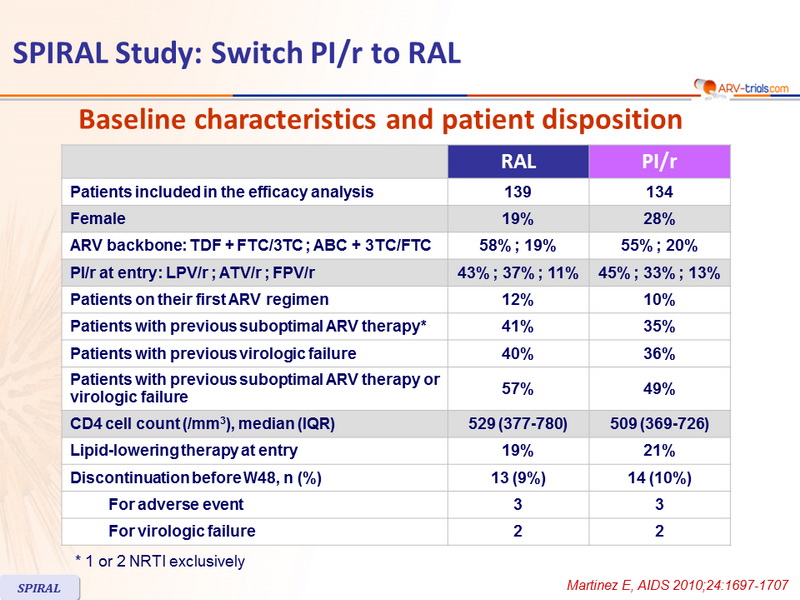
Baseline characteristics and patient disposition :
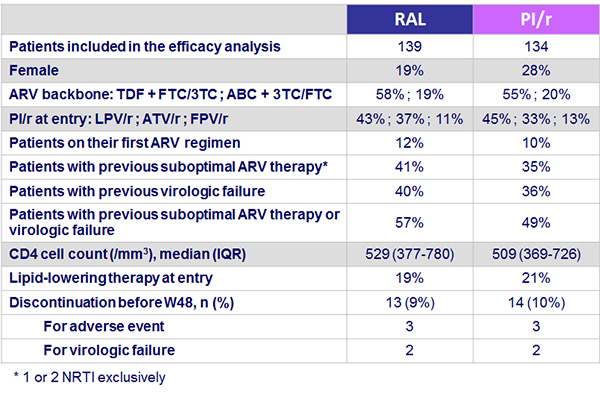
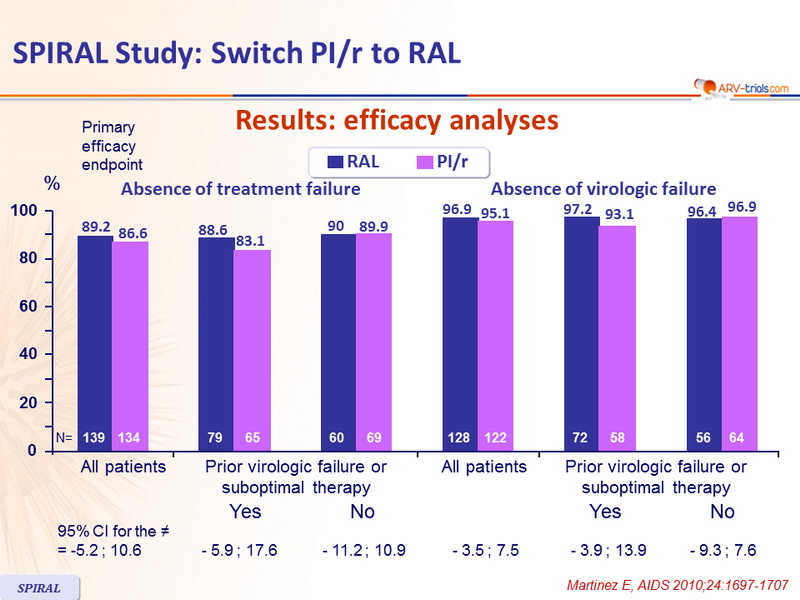
Results: Efficacy analyses :
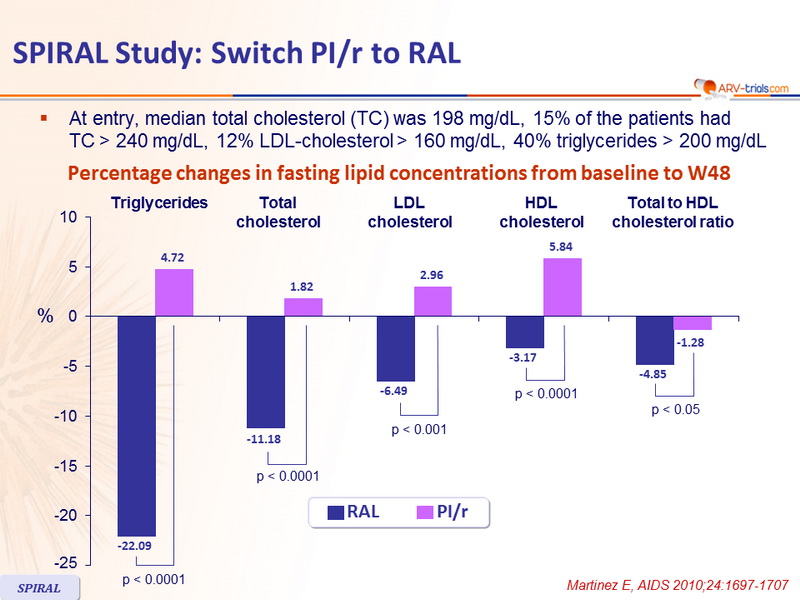
- At entry, median total cholesterol (TC) was 198 mg/dL, 15% of the patients had �TC > 240 mg/dL, 12% LDL-cholesterol > 160 mg/dL, 40% triglycerides > 200 mg/dL
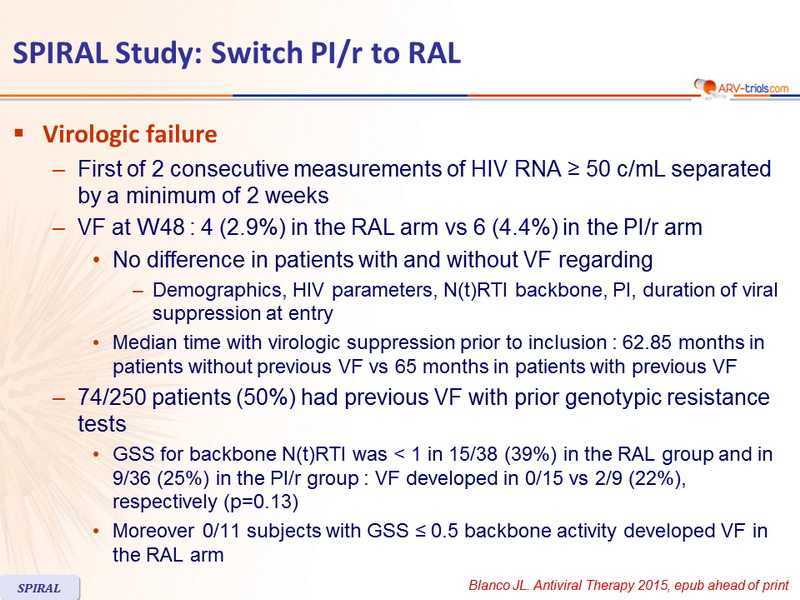
Virologic failure
- First of 2 consecutive measurements of HIV RNA ≥ 50 c/mL separated by a minimum of 2 weeks
- VF at W48 : 4 (2.9%) in the RAL arm vs 6 (4.4%) in the PI/r arm
- No difference in patients with and without VF regarding
- Demographics, HIV parameters, N(t)RTI backbone, PI, duration of viral suppression at entry
- Median time with virologic suppression prior to inclusion : 62.85 months in patients without previous VF vs 65 months in patients with previous VF
- 74/250 patients (50%) had previous VF with prior genotypic resistance tests
- GSS for backbone N(t)RTI was < 1 in 15/38 (39%) in the RAL group and in 9/36 (25%) in the PI/r group : VF developed in 0/15 vs 2/9 (22%), respectively (p=0.13)
- Moreover 0/11 subjects with GSS ≤ 0.5 backbone activity developed VF in the RAL arm
Percentage changes in fasting lipid concentrations from baseline to W48 :
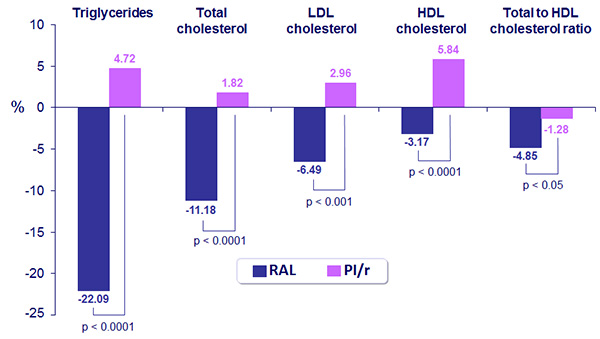
- At W48, significantly less patients had triglycerides > 200 mg/dL or total cholesterol > 240 mg/dL in the RAL group compared to the PI/r group: 14.6% vs 28.9% and 3.7% vs 17.2%, respectively
- Differences in total cholesterol and triglycerides changes in patients assigned to RAL were significant when switching from LPV/r but not from ATV/r
- There were no difference in the overall incidence of adverse events in the 2 groups
- The incidences of serious adverse events and events leading to drug discontinuation were similarly low in both groups
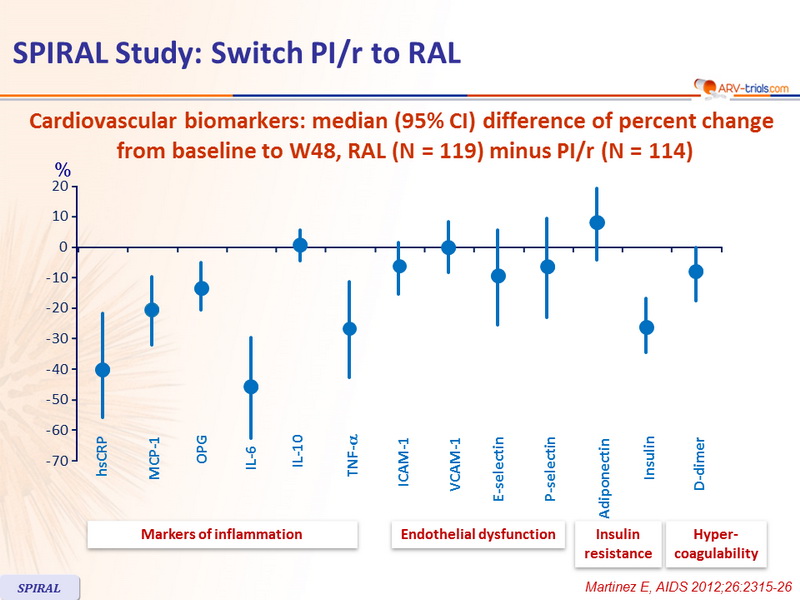
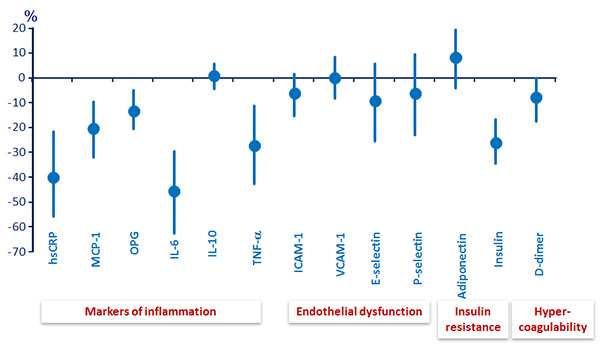
Cardiovascular biomarkers: median (95% CI) difference of percent change� from baseline to W48, RAL (N = 119) minus PI/r (N = 114) :
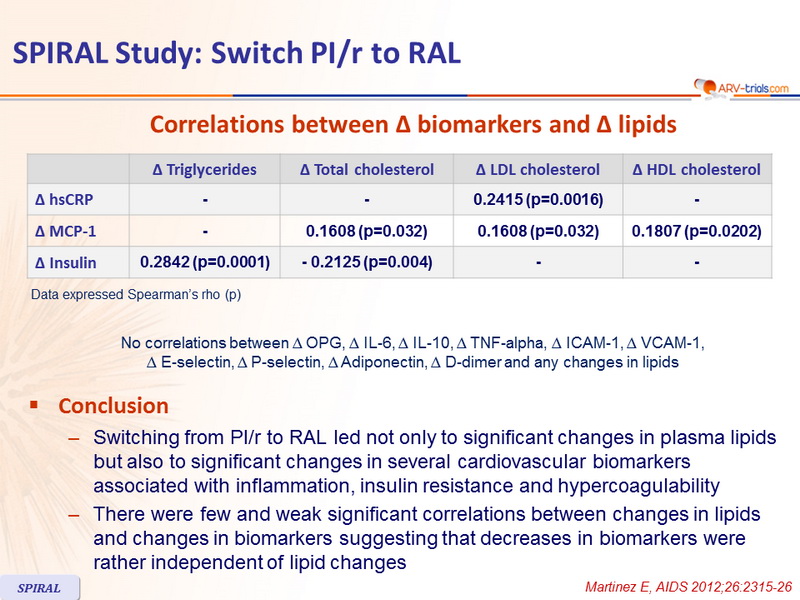
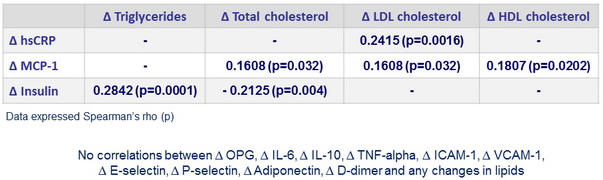
Correlations between ∆ biomarkers and ∆ lipids :
Conclusion
- Switching from PI/r to RAL led not only to significant changes in plasma lipids but also to significant changes in several cardiovascular biomarkers associated with inflammation, insulin resistance and hypercoagulability
- There were few and weak significant correlations between changes in lipids and changes in biomarkers suggesting that decreases in biomarkers were rather independent of lipid changes
SPIRAL Study: Switch PI/r to RAL�
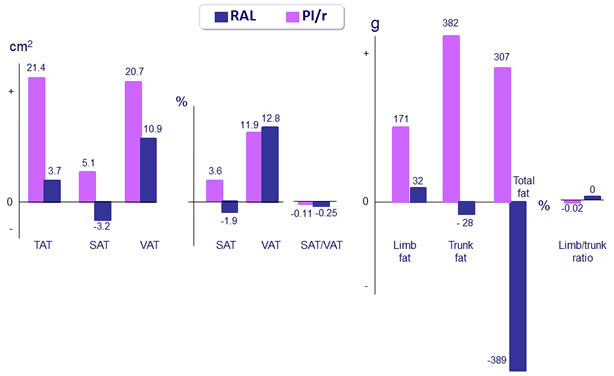
SPIRAL-LIP substudy (body composition)
Procedures at baseline and W48
- Whole body, lumbar and hip DEXA scans
- CT scan of abdomen (single cut 5 mm thick, at L4)
- Standardized protocol performed by a single radiologist unaware of patient’s treatment
Endpoints
- Primary: change in visceral adipose tissue (VAT) area (cm2)
- Secondary: changes in limb fat, trunk fat, total fat, total adipose tissue area, subcutaneous adipose tissue (SAT) area, SAT/VAT ratios, changes in bone mineral density and T scores in total body, spine (L1-L4) and hip (femoral neck and total hip)
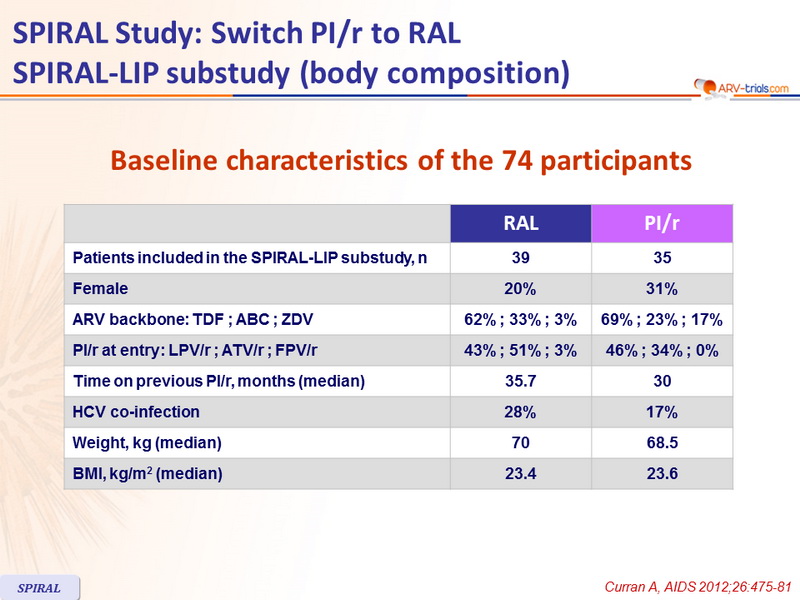
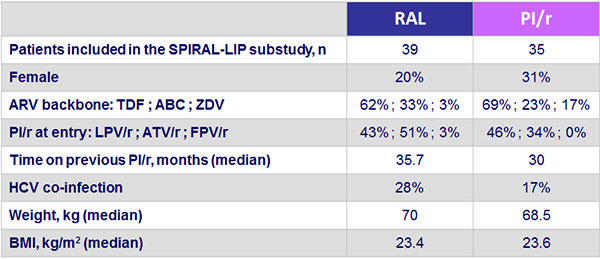
Baseline characteristics of the 74 participants :
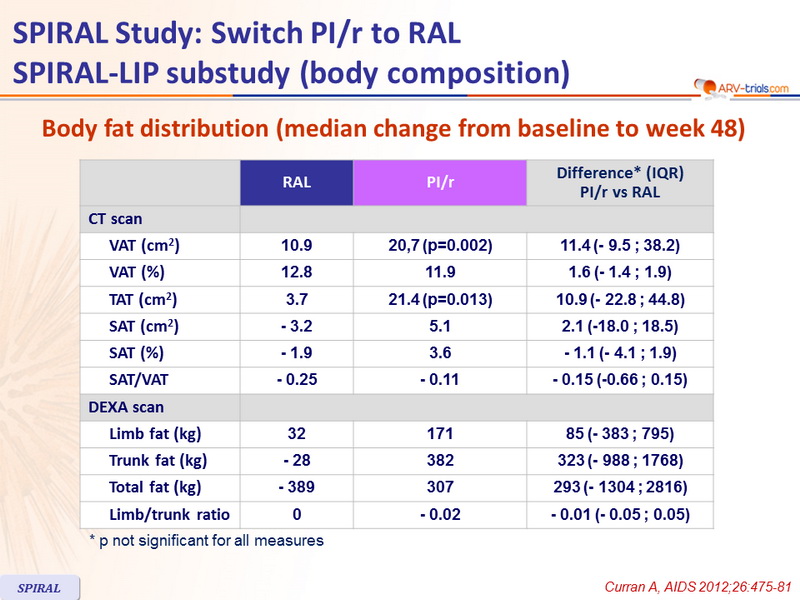
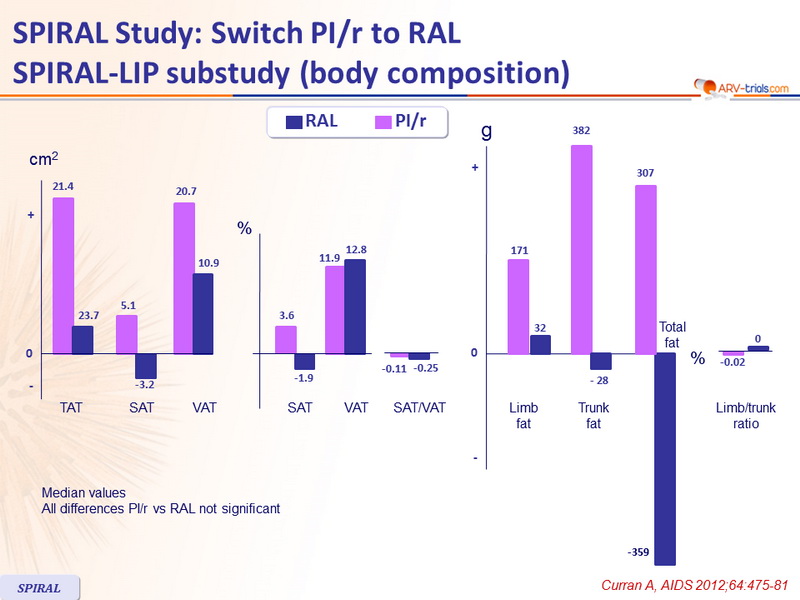
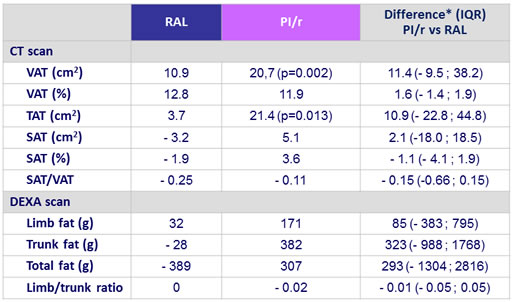
Body fat distribution (median change from baseline to week 48) :
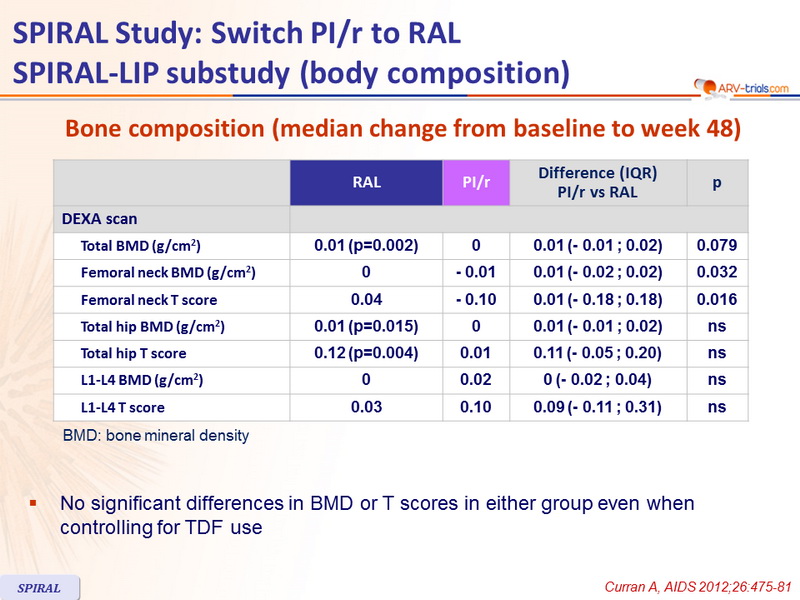
Bone composition (median change from baseline to week 48) :
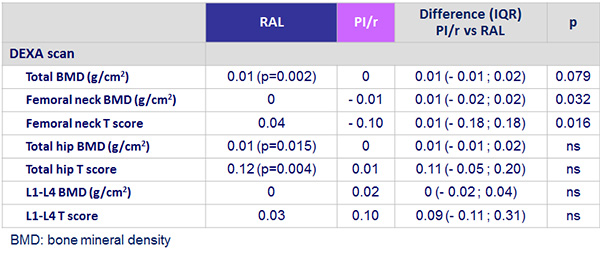
- No significant differences in BMD or T scores in either group even when controlling for TDF use
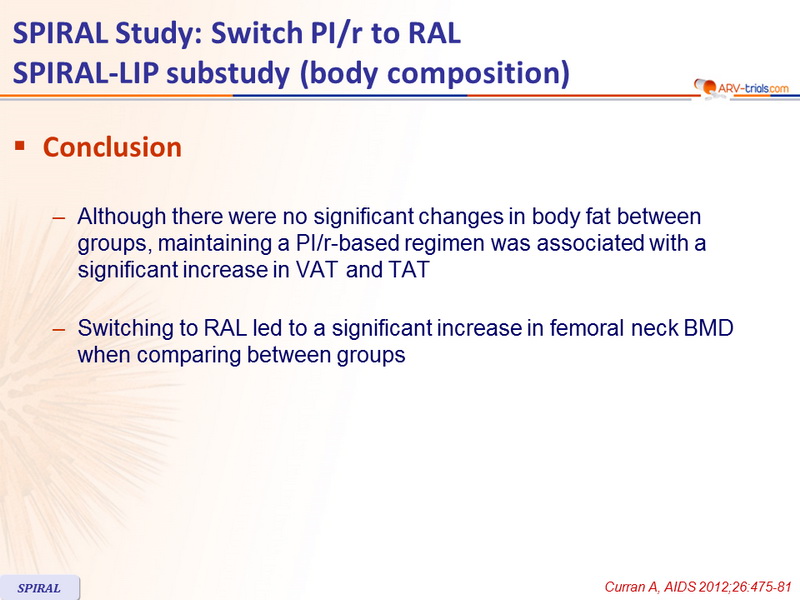
Conclusion
- Although there were no significant changes in body fat between groups, maintaining a PI/r-based regimen was associated with a significant increase in VAT and TAT
- Switching to RAL led to a significant increase in femoral neck BMD when comparing between groups
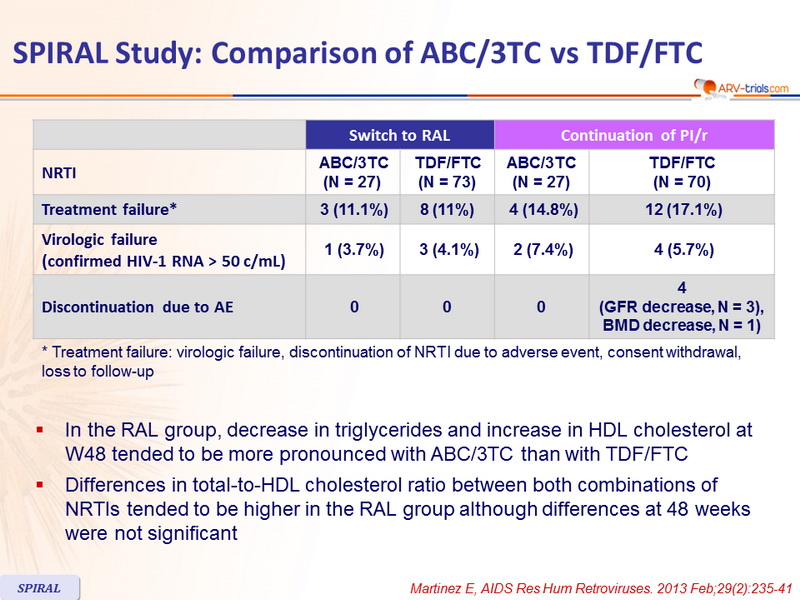
SPIRAL Study: Comparison of ABC/3TC vs TDF/FTC
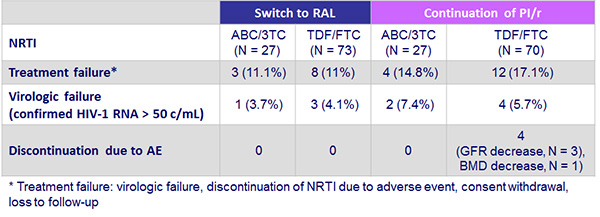
- In the RAL group, decrease in triglycerides and increase in HDL cholesterol at W48 tended to be more pronounced with ABC/3TC than with TDF/FTC
- Differences in total-to-HDL cholesterol ratio between both combinations of NRTIs tended to be higher in the RAL group although differences at 48 weeks were not significant
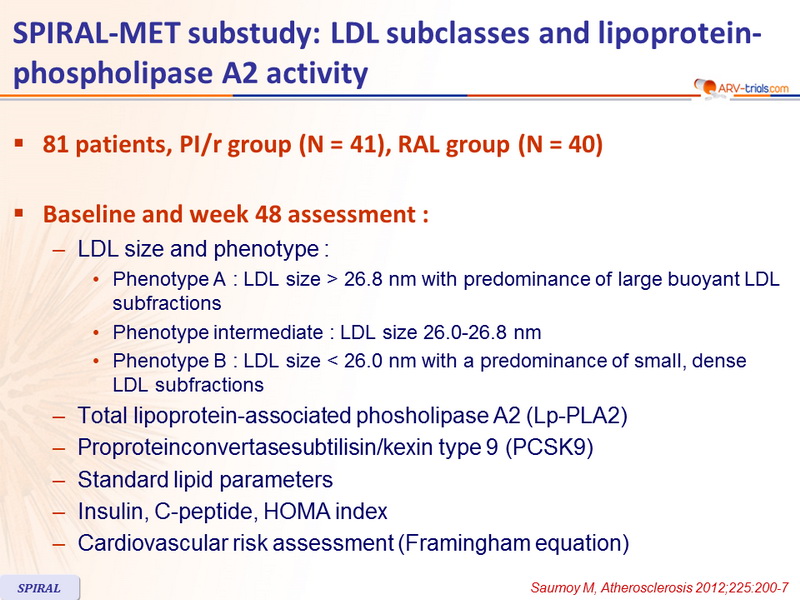
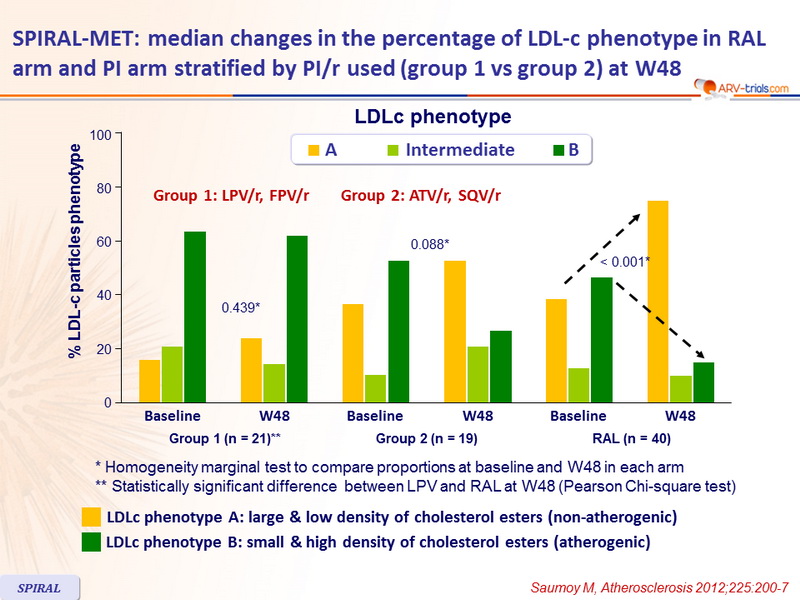
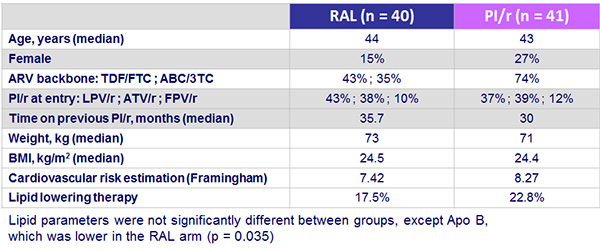
SPIRAL-MET substudy:
LDL subclasses and lipoprotein-phospholipase A2 activity
81 patients, PI/r group (n = 41), RAL group (n = 40)�
Baseline and week 48 assessment :
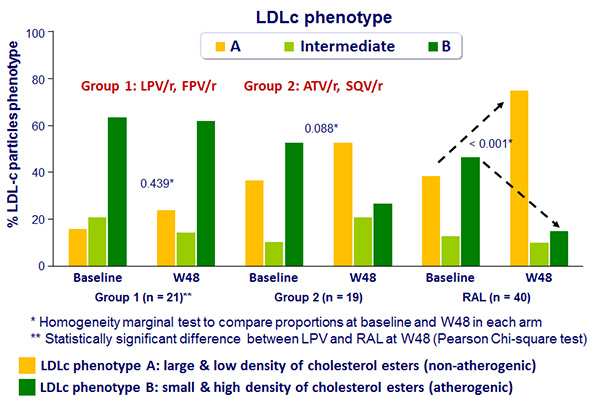
- LDL size and phenotype :
- Phenotype A : LDL size > 26.8 nm with predominance of large buoyant LDL subfractions
- Phenotype intermediate : LDL size 26.0-26.8 nm
- Phenotype B : LDL size < 26.0 nm with a predominance of small, dense LDL subfractions
- Total lipoprotein-associated phosholipase A2 (Lp-PLA2)
- Proprotein convertase subtilisin/kexin type 9 (PCSK9)
- Standard lipid parameters
- Insulin, C-peptide, HOMA index
- Cardiovascular risk assessment (Framingham equation)
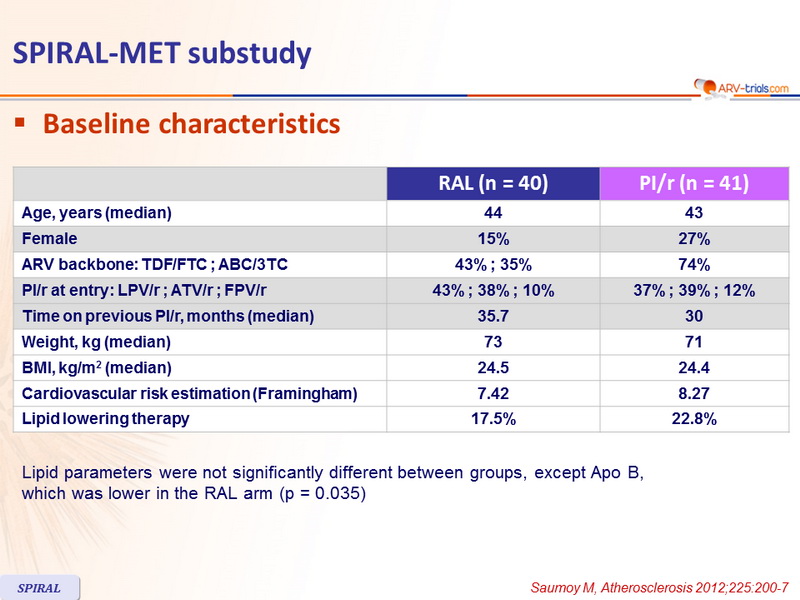
SPIRAL-MET substudy
Baseline characteristics :
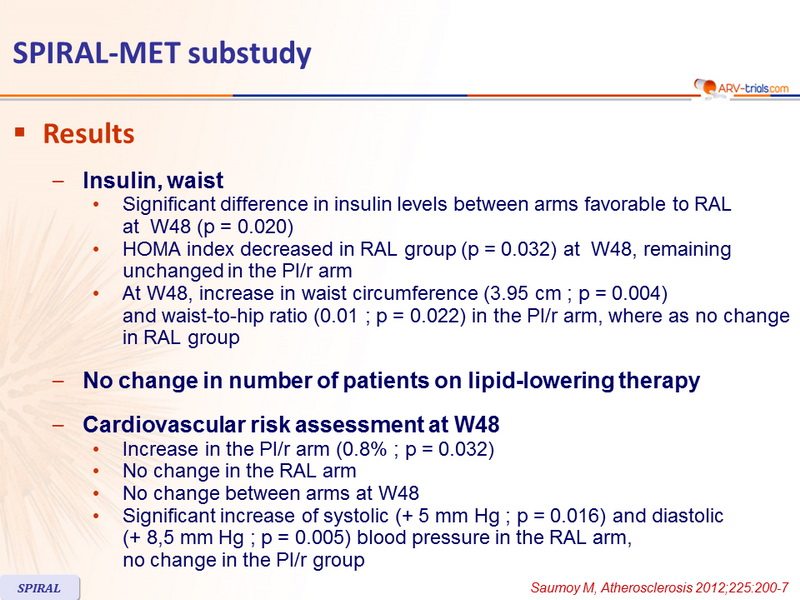
Results :
- Insulin, waist
- Significant difference in insulin levels between arms favorable to RAL �at W48 (p = 0.020)
- HOMA index decreased in RAL group (p = 0.032) at W48, remaining unchanged in the PI/r arm
- At W48, increase in waist circumference (3.95 cm ; p = 0.004) �and waist-to-hip ratio (0.01; p = 0.022) in the PI/r arm, where as no change in RAL group�
- No change in number of patients on lipid-lowering therapy�
- Cardiovascular risk assessment at W48
- Increase in the PI/r arm (0.8% ; p = 0.032)
- No change in the RAL arm
- No change between arms at W48
- Significant increase of systolic (+ 5 mm Hg; p = 0.016) and diastolic �(+ 8,5 mm Hg; p = 0.005) blood pressure in the RAL arm, �no change in the PI/r group
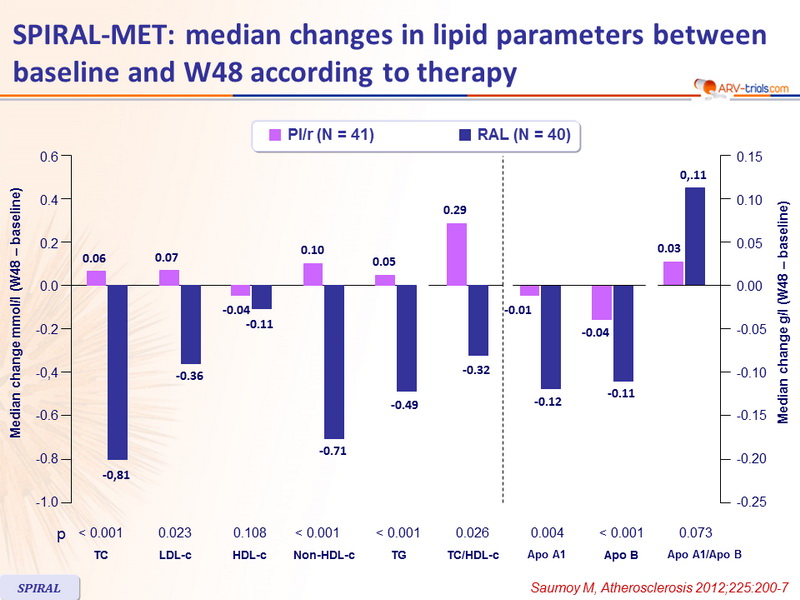
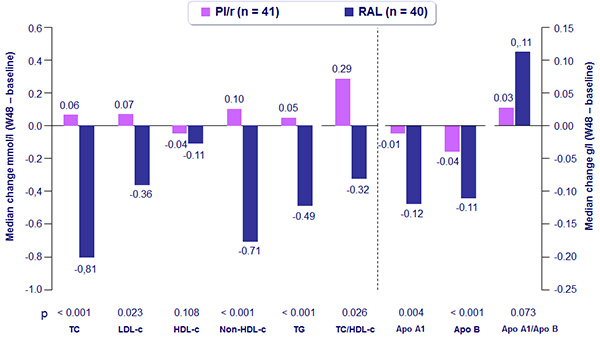
Median changes in lipid parameters between baseline and W48 according to therapy
Median changes in the percentage of LDL-c phenotype in RAL arm
and PI arm stratified by PI/r used (group 1 vs group 2) at W48 :
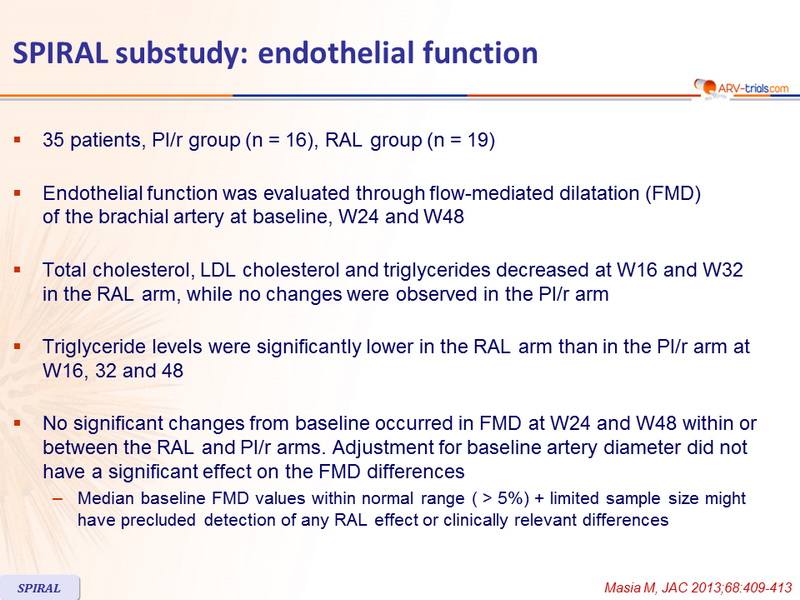
SPIRAL substudy: endothelial function :
- 35 patients, PI/r group (n = 16), RAL group (n = 19)�
- Endothelial function was evaluated through flow-mediated dilatation (FMD) �of the brachial artery at baseline, W24 and W48�
- Total cholesterol, LDL cholesterol and triglycerides decreased at W16 and W32 �in the RAL arm, while no changes were observed in the PI/r arm�
- Triglyceride levels were significantly lower in the RAL arm than in the PI/r arm at W16, 32 and 48�
- No significant changes from baseline occurred in FMD at W24 and W48 within or between the RAL and PI/r arms. Adjustment for baseline artery diameter did not have a significant effect on the FMD differences
- Median baseline FMD values within normal range ( > 5%) + limited sample size might have precluded detection of any RAL effect or clinically relevant differences
 Back to Table of Contents Back to Table of Contents
|