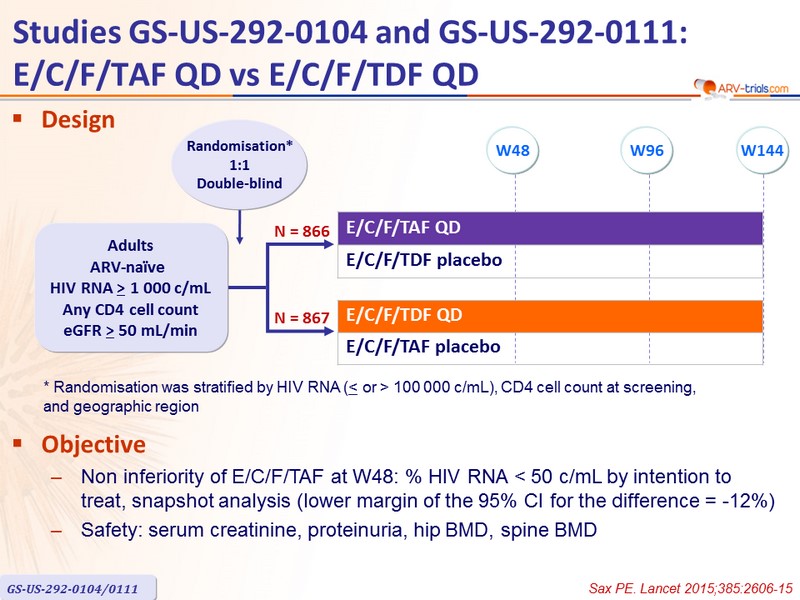
Head-to-head comparative trials for first line ART since 2006

Comparison of NRTI combos
Studies GS-US-292-0104 and GS-US-292-0111 :
E/C/F/TAF QD vs E/C/F/TDF QD
Original article : Sax PE. Lancet 2015; 385:2606-15, Wohl D. J Acquir Immune Defic Syndr 2016; 72:58-64 & Arribas JR, CROI 2017, Abs. 453
Last update : 29/03/2017

Dr Anton Pozniak
Chelsea and Westminster Hospital
London, UK

  • Summary of week 48 results
  • E/C/F/TAF QD is virologically non inferior to E/C/F/TDF QD
  • 92% of patients treated with E/C/F/TAF achieved virologic suppression through week 48
  • High and similar response rates, irrespective of baseline HIV RNA and CD4 cell count, age, sex, race
  • Low rates of virologic failure, with resistance emergence < 1% in both arms
  • CD4 response from baseline significantly higher with E/C/F/TAF
  • Discontinuation because of adverse events: 0.9 % vs 1.5 %
    • Discontinuation due to renal events: 0 vs 4
  • Common adverse events occurred at similar frequency in both arms
  • No case of proximal tubulopathy
  • Compared with E/C/F/TDF, E/C/F/TAF demonstrated
    • Significantly smaller decreases in eGFR
    • Significantly less proteinuria, albuminuria, and tubular proteinuria
    • Significantly less impact on spine and hip BMD
    • Greater increases in fasting lipids

Design


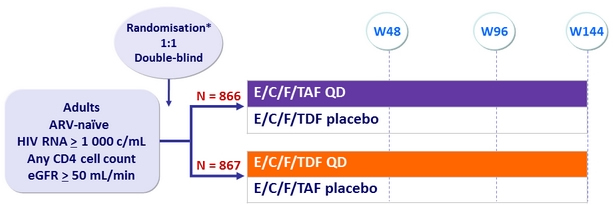
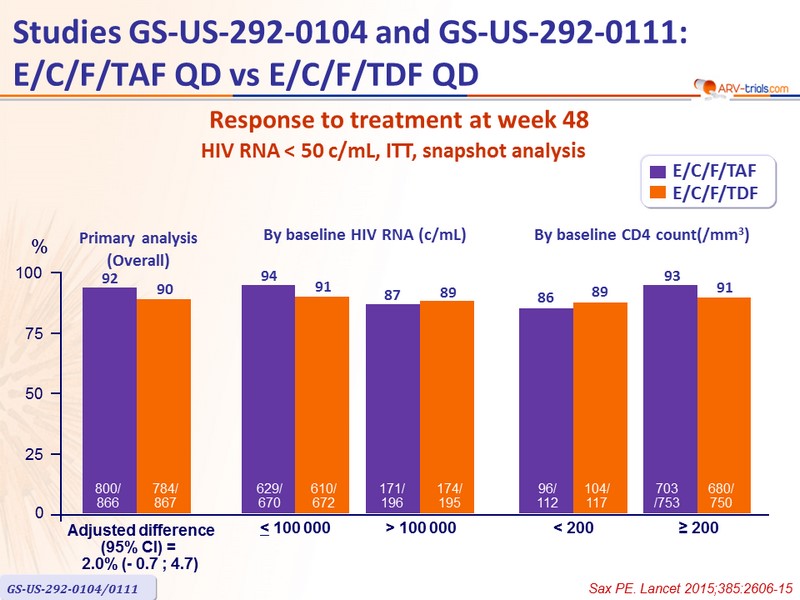
* Randomisation was stratified by HIV RNA (≤ or > 100,000 c/mL), CD4 cell count at screening,
and geographic region

Objective :

  • Non inferiority of E/C/F/TAF at W48: % HIV RNA < 50 c/mL by intention to treat, snapshot analysis (lower margin of the 95% CI for the difference = -12%)
  • Safety: serum creatinine , proteinuria, hip BMD, spine BMD

Baseline characteristics and patient disposition

Plasma TFV and intracellular TFV-DP levels

  • Intensive PK substudy :
    • E/C/F/TAF, N = 36 (PBMC substudy : 21/36)
    • E/C/F/TDF, N = 29 ( PBMC substudy : 14/29)

Response to treatment at week 48
HIV RNA < 50 c/mL, ITT, snapshot analysis

Secondary endpoints


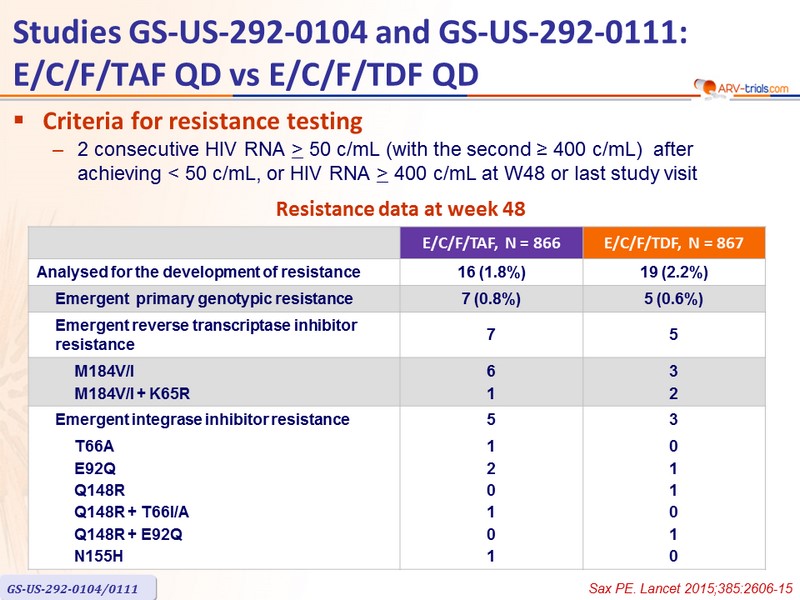
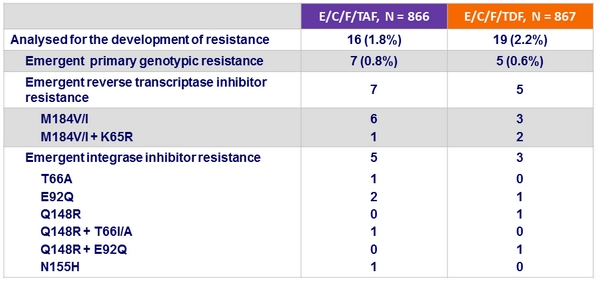
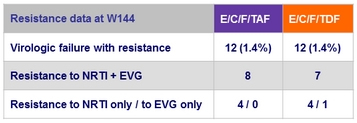
Criteria for resistance testing

  • 2 consecutive HIV RNA ≥ 50 c/mL (with the second ≥ 400 c/mL ) after achieving < 50 c/mL , or HIV RNA ≥ 400 c/mL at W48 or last study visit

Resistance data at week 48

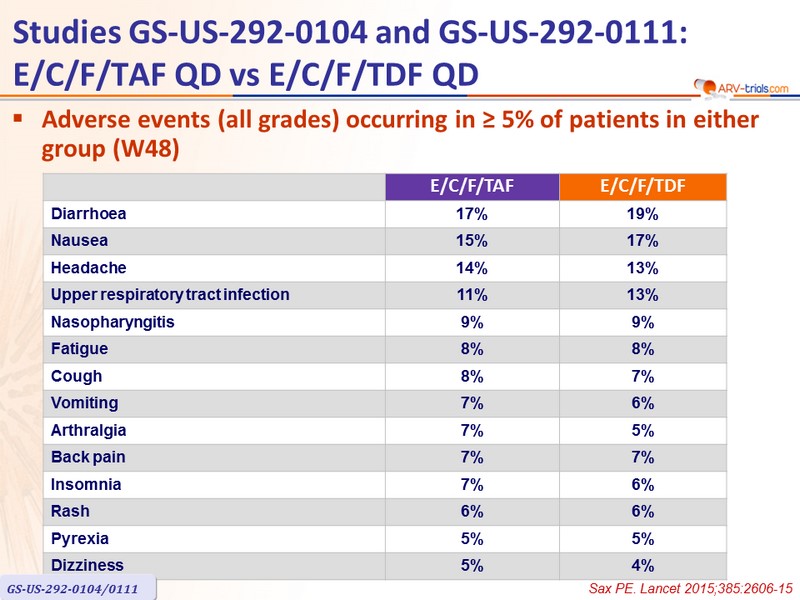
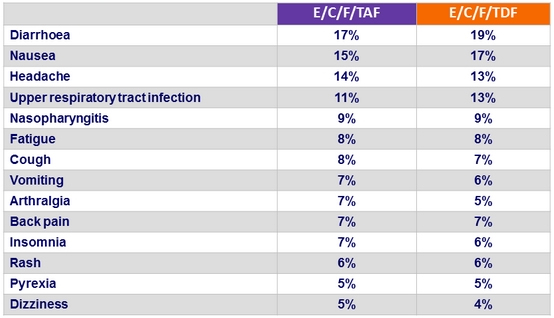
Adverse events (all grades) occurring in ≥ 5% of patients in either group (W48)

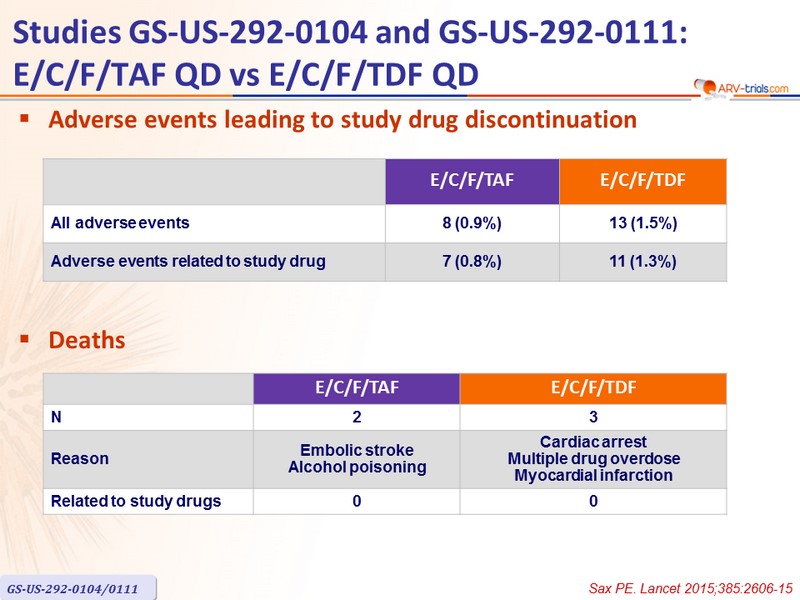
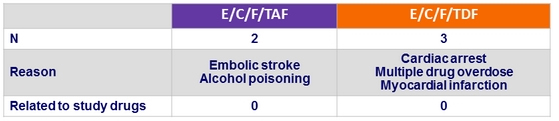
Adverse events leading to study drug discontinuation
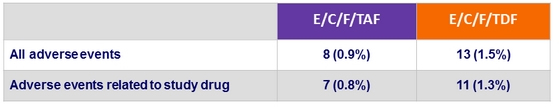
Deaths

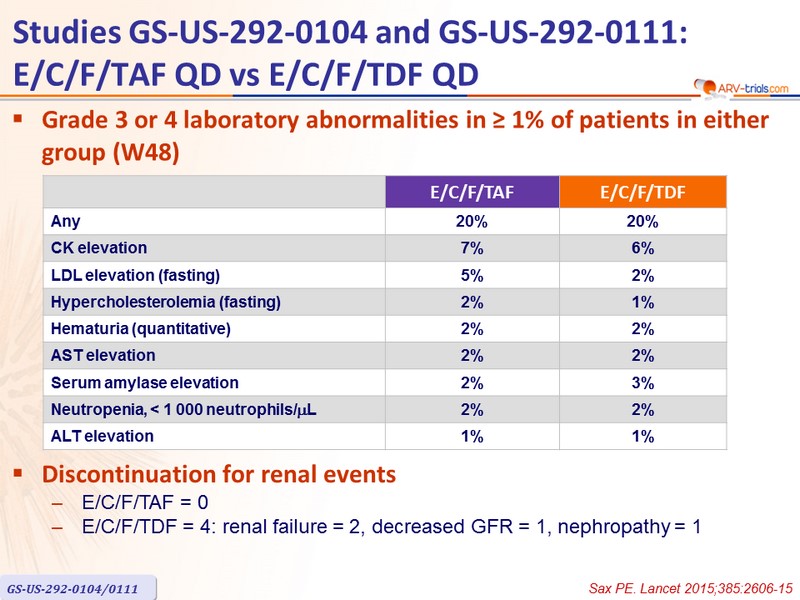
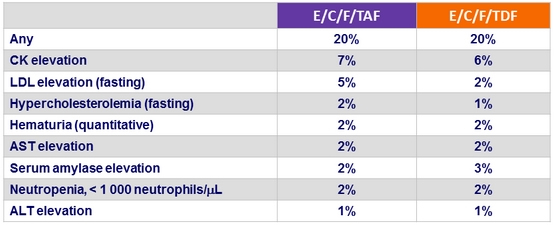
Grade 3 or 4 laboratory abnormalities in ≥ 1% of patients in either group (W48)

Discontinuation for renal event

  • E/C/F/TAF = 0
  • E/C/F/TDF = 4 : renal failure = 2, decreased GFR = 1, nephropathy = 1

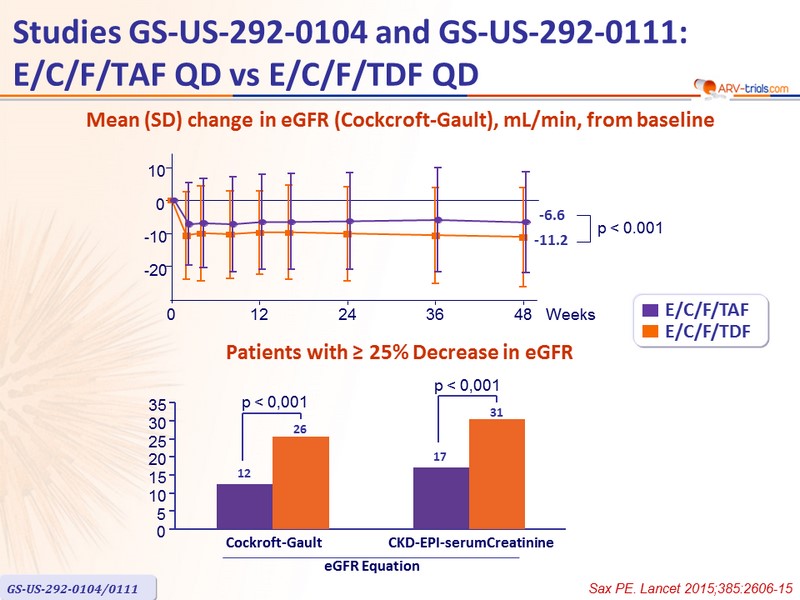
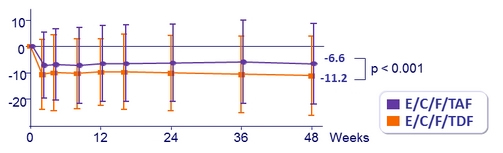
Mean (SD) change in eGFR (Cockcroft-Gault), mL /min, from baseline

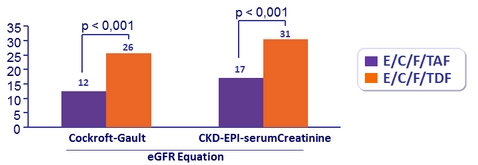
Patients with ≥ 25% Decrease in eGFR

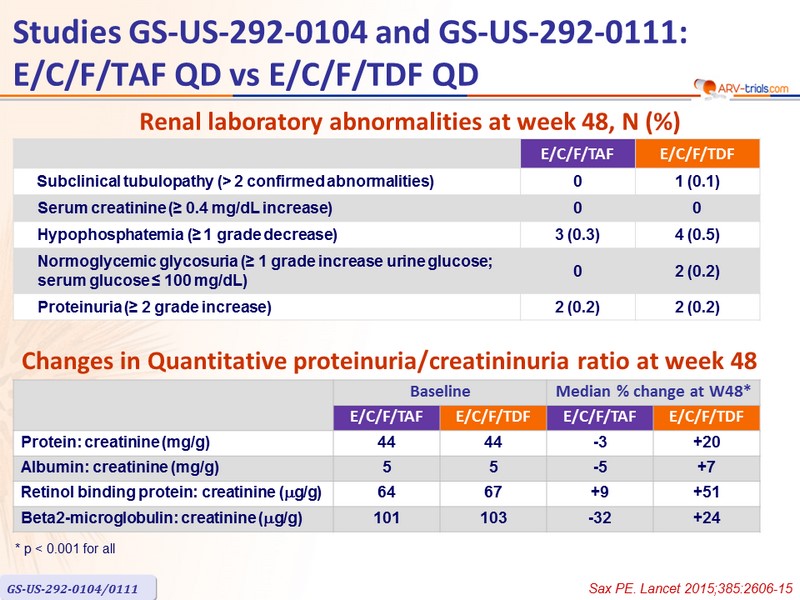
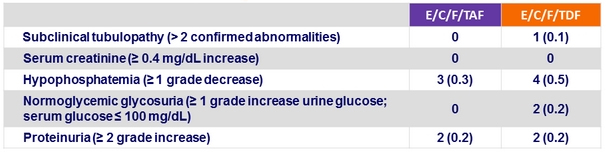
Renal laboratory abnormalities at week 48, n (%)

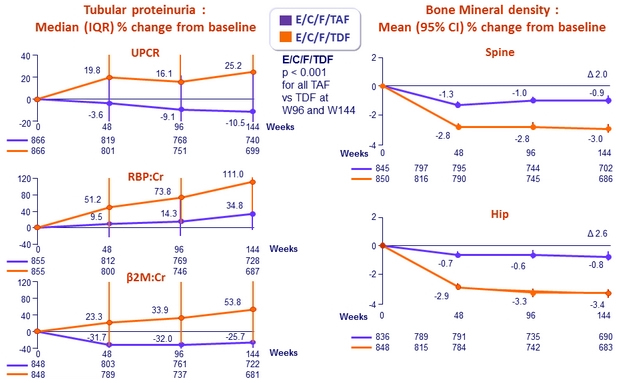
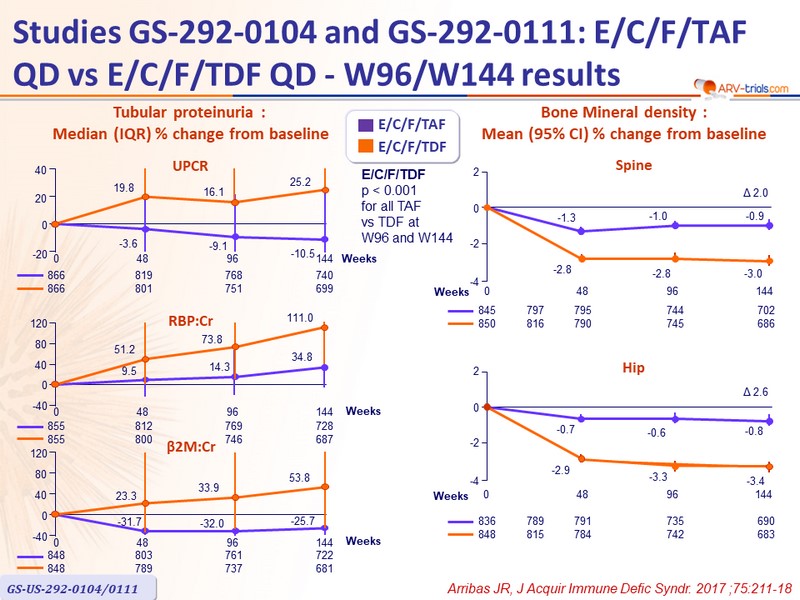
Changes in Quantitative proteinuria/creatininuria ratio at week 48
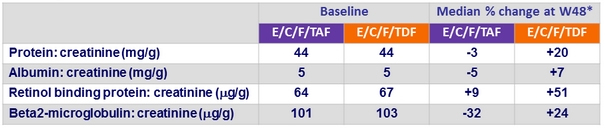

* p < 0.001 for all

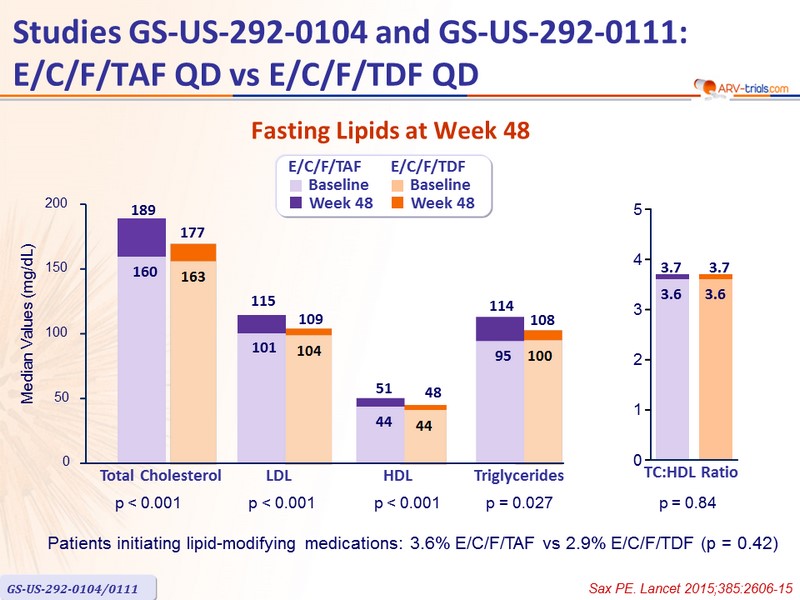
Fasting Lipids at Week 48

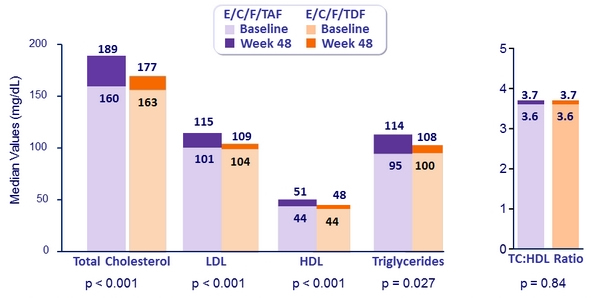
Patients initiating lipid-modifying medications: 3.6% E/C/F/TAF vs 2.9% E/C/F/TDF (p = 0.42)

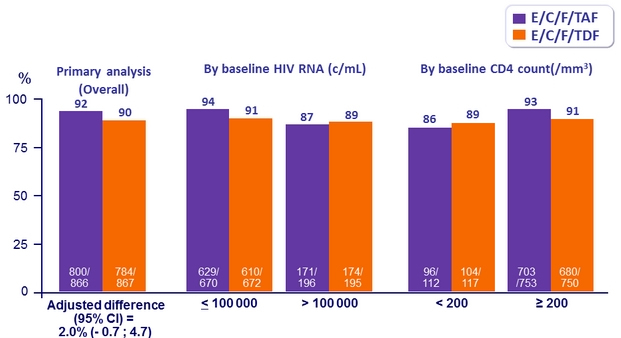
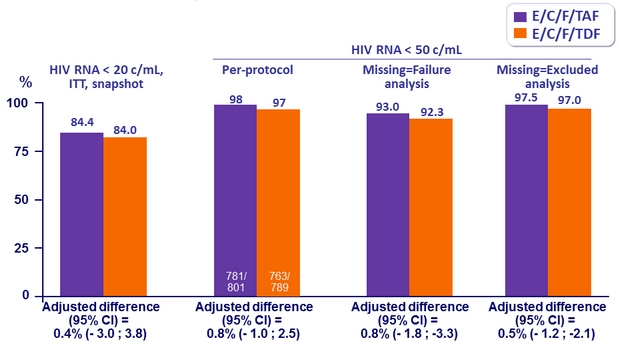
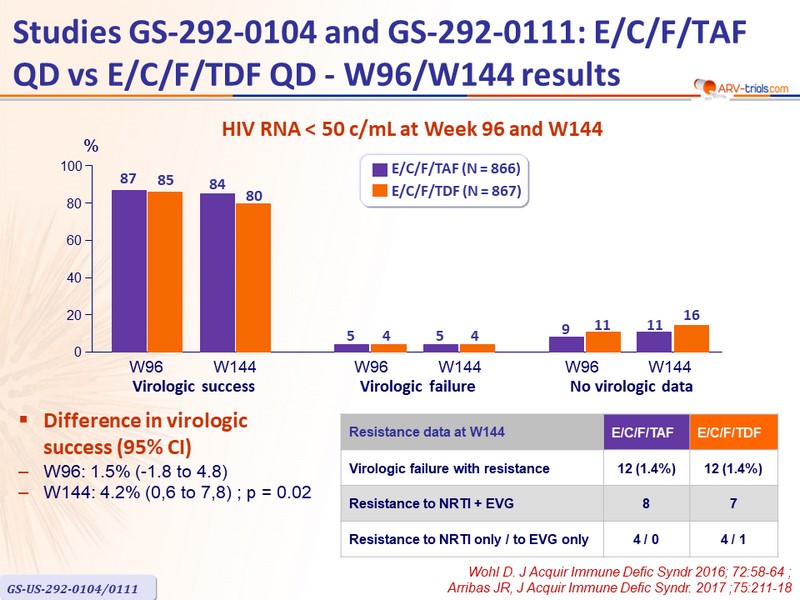
HIV RNA < 50 c/mL at Week 96 and W144

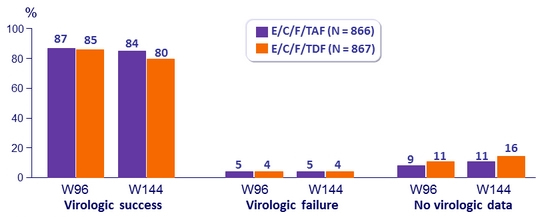
Difference in virologic success (95% CI)

  • W96: 1.5% (-1.8 to 4.8)
  • W144: 4.2% (0,6 to 7,8) ; p = 0.02

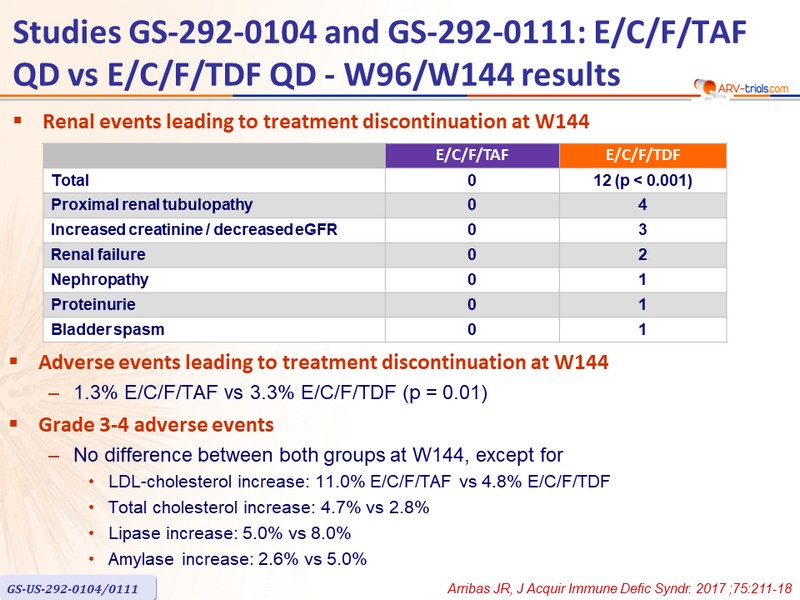
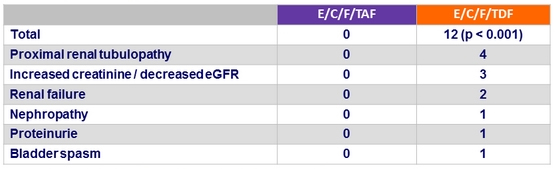
Renal events leading to treatment discontinuation at W144

Adverse events leading to treatment discontinuation at W144

  • 1.3% E/C/F/TAF vs 3.3% E/C/F/TDF (p = 0.01)

Grade 3-4 adverse events

  • No difference between both groups at W144, except for
    • LDL-cholesterol increase: 11.0% E/C/F/TAF vs 4.8% E/C/F/TDF
    • Total cholesterol increase: 4.7% vs 2.8%
    • Lipase increase: 5.0% vs 8.0%
    • Amylase increase: 2.6% vs 5.0%


Back to Table of Contents

Copyright AEI 2020 | Links | Contact | Editorial Office | Faculty and Disclosure | Terms of use aei